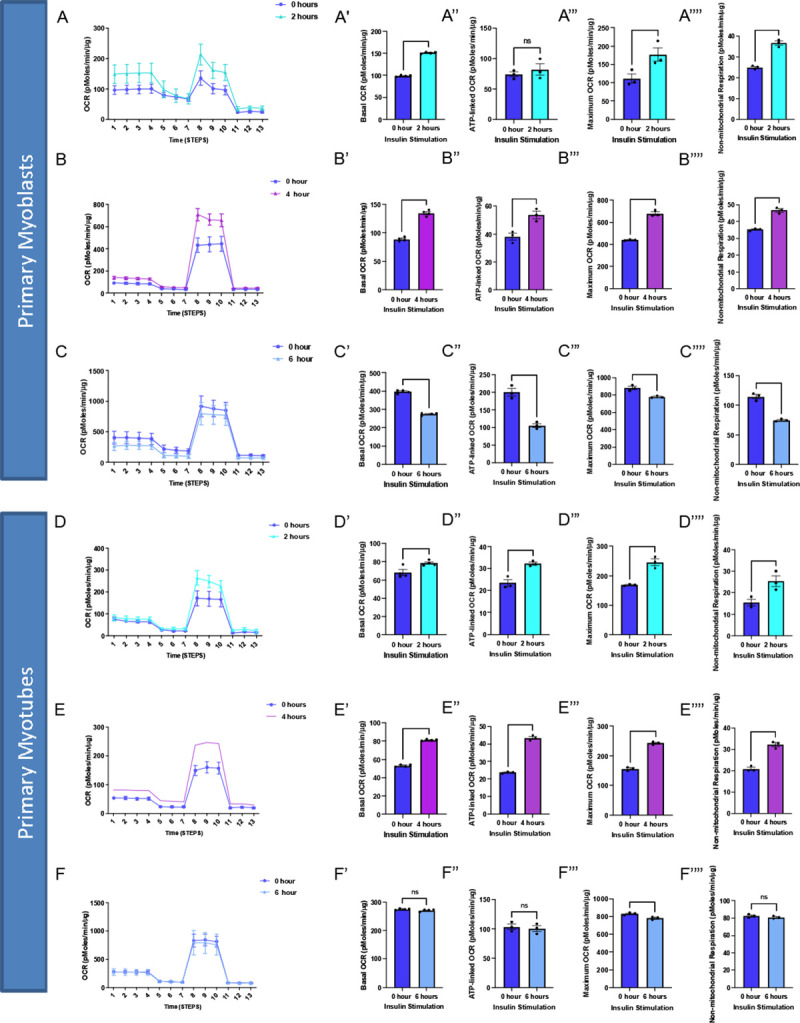
Figure 5:

Oxygen consumption rate (OCR) altered in myoblasts and myotubes upon altered insulin stimulation which shows changes in mitochondrial efficiency. (A) Seahorse plot for primary myoblasts following 2 hours of insulin stimulation (B) 4 hours of insulin stimulation and (C) 6 hours of insulin stimulation. (D) Oxygen consumption rate was measured after several inhibitors to measure respiration in primary myotubes after 2 hours, (E) 4 hours and (F) 6 hours of insulin stimulation. (A’-F’) Basal OCR which represents respiration under normal, unstressed conditions. (A”-F”) ATP-linked OCR, which is respiration associated with ATP synthesis during oxidative phosphorylation which is marked by a reduction in OCR due to oligomycin. (A”‘-F”‘) Maximum OCR which is the maximal capacity at which mitochondria may utilize oxygen. (A”“-F”“) Non-mitochondrial respiration which can be attributed to factors such as glycolysis or ROS and not due to mitochondrial respiration.These values were compared to the control (blue) in all of these examples. N = 6 per treatment, and * indicates p-value < .05.
