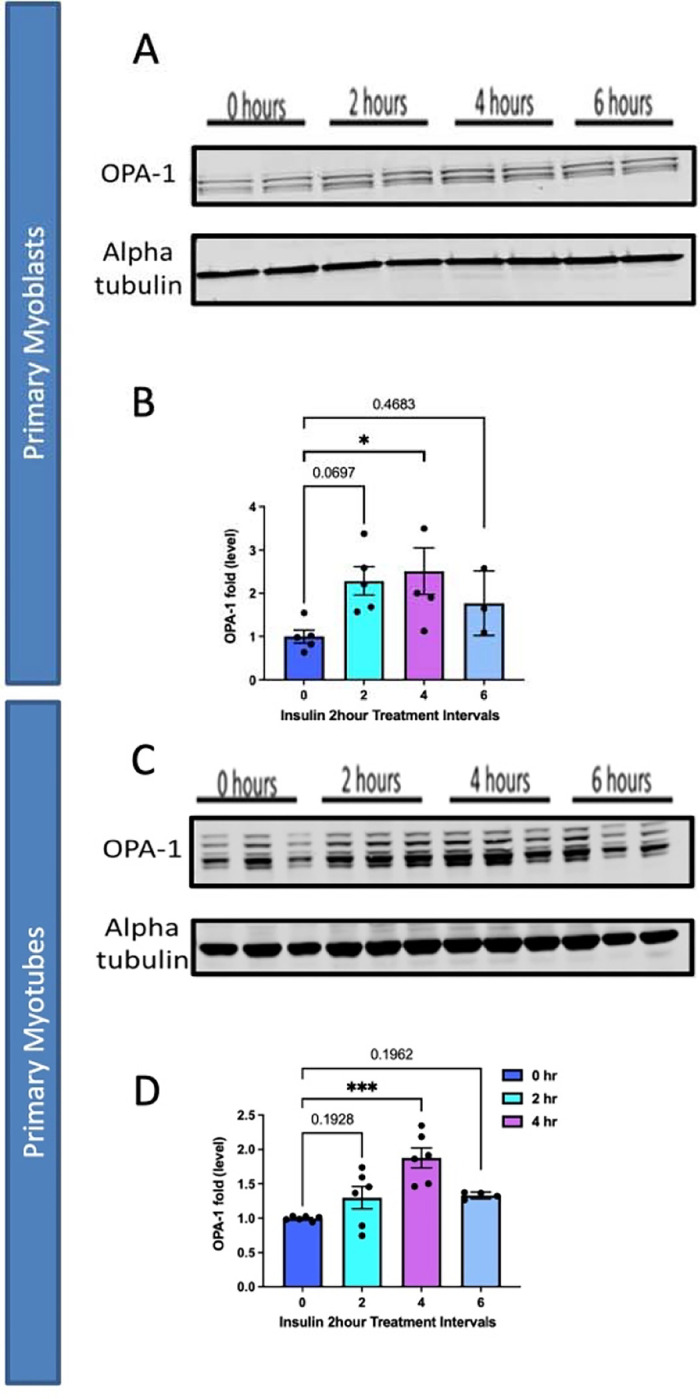
Figure 6:

Comparison of mitochondrial fusion proteins following insulin stimulation in primary myoblasts and myotubes. (A) Western blotting for mitochondrial fusion protein OPA-1 following 2 hours, 4 hours, and 6 hours of insulin stimulation. (B) OPA-1 levels normalized to Alpha tubulin following insulin stimulation. (C) This was replicated in primary myotubes, as western blotting for mitochondrial fusion OPA1. (D) OPA-1 levels, normalized to Alpha tubulin, in primary myotubes following insulin treatment. N = 6 per treatment, and * indicates p-value < 378 .05.
