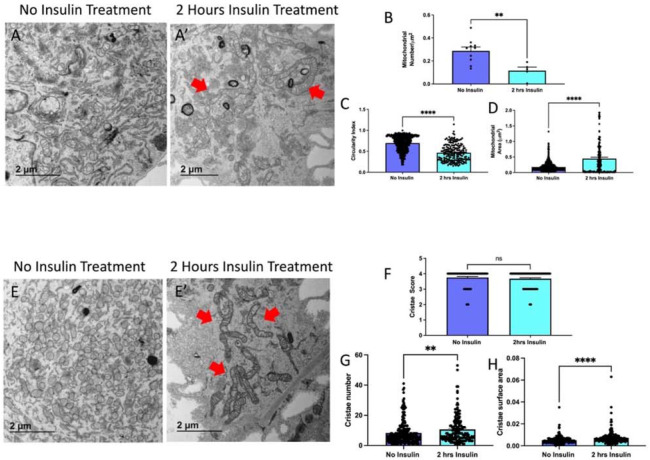
Figure 7. TEM Quantification of Myoblasts.
(A) Representative transmission electron micrographs from control and (A’) insulin-treated cells, with red arrows showing fused mitochondria. (B) Quantifications of number of mitochondria, (C) circularity of mitochondria, (D) and area of mitochondria. (E) Representative transmission electron micrographs from control and (E’) insulin-treated cells, with red arrows showing cristae. (F) Quantifications from cristae score, (G) cristae quantity, and (H) cristae area comparing non-insulin and insulin-treated myoblasts. Dots show the number of samples. ** and **** indicates p < 0.01 and p < 0.0001, respectively.

