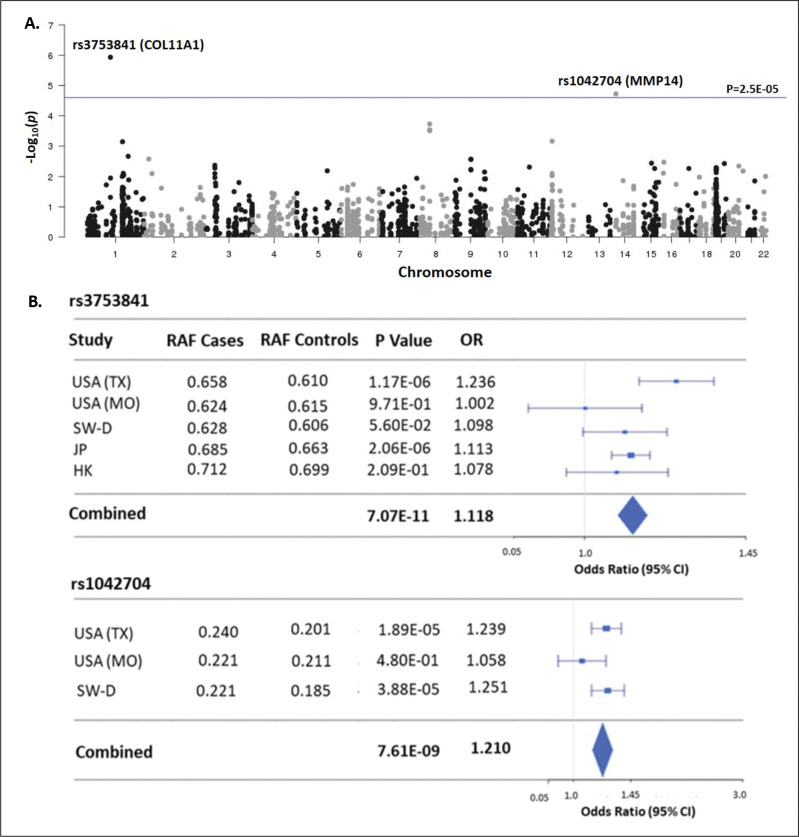
Figure 1. Matrisome-wide association study.
a. Manhattan plot showing −log10 P-values (y axis) versus chromosomal position (x axis) for the 2,008 common coding variants tested in the discovery study USA (TX). The horizontal line represents the threshold for significance level (P-value<2.5×10⁻⁵) after Bonferroni multiple testing correction. b. Tests of association for SNPs rs3753841 and rs1042704 in discovery and independent replication cohorts. RAF - reference allele frequency; OR - odds ratio; CI-confidence interval.

