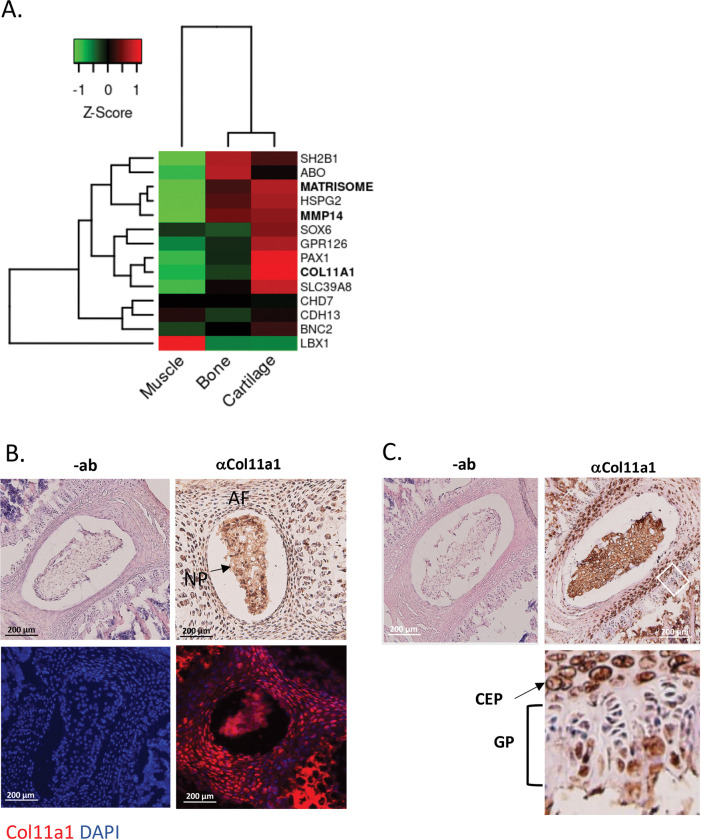
Figure 2. Col11a1 and Mmp14 expression in spine.
a) A heatmap of transcript per million (TPM) values of COL11A1, MMP14, and other published genes associated with AIS. The average TPM value of matrisome genes is represented as MATRISOME.
b) Detection of collagen type XI alpha chain 1 in P0.5 mouse spine. Immunohistochemistry (IHC) shown at top, with immunofluorescence (IF) staining below. “-ab” refers to negative controls lacking primary antibody (shown at left). Results are representative of N≥3 technical replicates in whole spines.
c) Detection of collagen a1(XI) in P28 mouse spine. Negative antibody IHC control shown at left; antibody positive IHC shown at right. Enlarged, rotated view of white boxed area shows a biphasic staining pattern. CEP – cartilage endplate; GP – growth plate. Results are representative of N≥3 technical replicates in whole spines.

