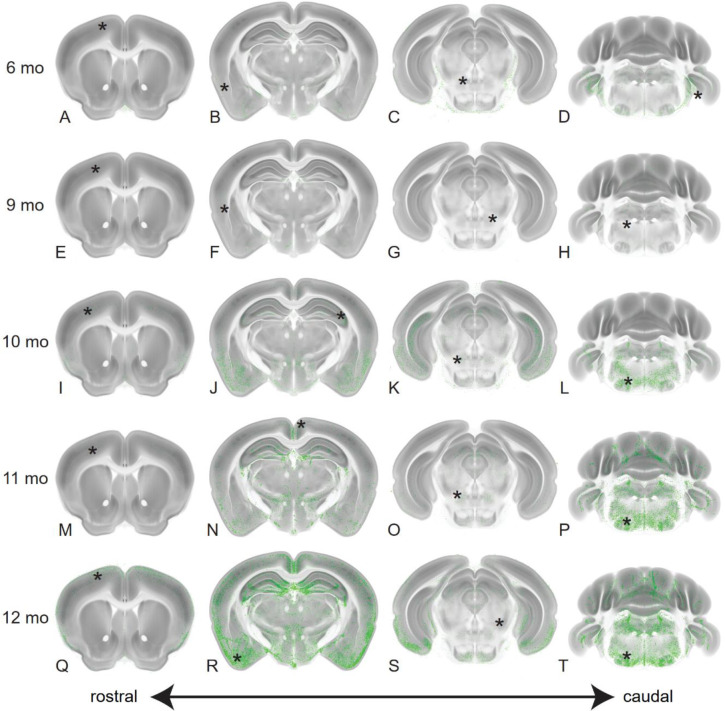
Fig. 2. P-tau pathology initiates caudally and progresses rostrally.
We show maximum intensity projections (MIP) of p-tau probability maps in each age group at selected anatomical levels. Four coronal sections spanning the rostro-caudal extent of the brain at the levels of the anterior cortex, dorsal hippocampus, midbrain and cerebellum are shown for brains of the indicated ages (6mo = Panels A-D; 9mo = Panels E-H; 10mo = Panels I-L; 11mo = Panels M-P; 12mo = Panels Q-T). P-tau probabilities are shown in green and the CCF average template in grey. The total numbers of brains in the dataset in each age group (6mo, n= 5; 9mo, n= 3, 10mo, n= 6; 11mo, n= 5; 12mo, n= 4) were used to generate MIP images of each physical section. Progressive accumulation of p-tau was visible across many brain regions, notably brainstem, hippocampus and ventral cortical areas including entorhinal (ENT), cortical amygdala (COA) and piriform (PIR) regions. Asterisks on each section indicate the location of the corresponding enlarged images shown in Fig. S2.

