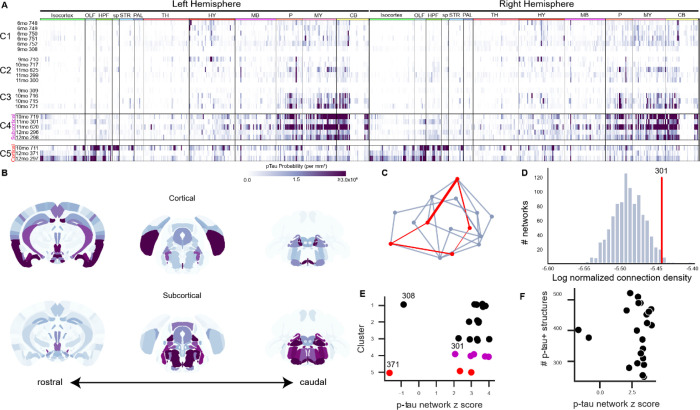
Fig. 3. Patterns of spontaneous p-tau pathology match structural connectivity.
(A) Raster plots showing automated quantification of region-normalized p-tau probability levels in each of the 630 structures annotated in the Allen Institute CCFv3. Displayed values were truncated at 3×10⁶ to visualize lower-intensity regions. Clustering based on brain-wide patterns of pathology identified progressive accumulation of p-tau in a predominantly subcortical pattern (C1-C4), but a subset of three brains exhibited an alternate pattern with heavier pathology in cortical regions (C5). Both “Subcortical” (C4) and “Cortical” (C5) clusters of brains with high p-tau burdens were composed of aged mice (10-12mo). Labels across the top indicate major brain divisions. Abbreviations: OLF: Olfactory areas; HPF: Hippocampal formation; sp: Cortical subplate; STR: Striatum; PAL: Pallidum; TH: Thalamus; HY: Hypothalamus; MB: Midbrain; P: Pons; MY: Medulla; CB: Cerebellum. (B) Maps showing the spatial pattern of p-tau pathology by annotated brain region. Median values are shown for n=3 brains with pronounced Cortical pathology patterns and n=5 brains with Subcortical pathology (indicated by boxes in A). Coronal sections at the levels of the hippocampus (left), midbrain (center), and brainstem (right) are shown for each pattern. Heatmap is the same as A. (C) Schematic of method used to evaluate whether p-tau levels were related to connectivity. For each brain, the set of regions (nodes) that contained p-tau signal (red points) were identified and the sum of the anatomical connection strength between regions was calculated by summing all the edges in this graph (red lines). Inter-regional connection strength values came from the regionalized voxel model in Knox et al. (33). The strengths of all the connections in this network were summed and compared to results of 1000 alternative networks drawn from the same brain-wide connectivity matrix and containing a similar distribution of inter-regional distances (blue-gray lines). (D) Histogram of the total connection strength of 1000 alternative networks (blue bars) compared to the connection strength of observed a representative p-tau positive network from Sample 301 (red line). The structures positive for p-tau in Sample 301 had a total connection density of ~3.5×10⁻⁶, which is higher than ~98% of the possible networks that could be formed with a similar distance distribution. (E) In most brains, p-tau positive structures were more highly connected than expected by chance, as indicated by their network z scores. There was no relationship between the cluster assignments in panel A and the connectivity strength of the corresponding p-tau positve networks (compare along y-axis), or between cortical-dominant or subcortical-dominant p-tau patterns and network connection strength (compare red points and magenta points). There was no obvious similarity between the two brains that showed lower connection strength in their p-tau positive networks (308 and 371). (F) There was no relationship between the number of p-tau positive structures in a brain and network connection strength.

