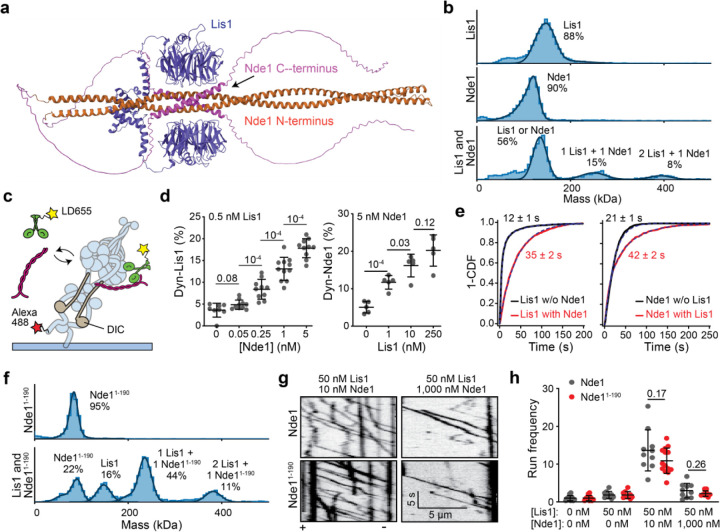
Figure 2. The N-terminal coiled-coil of Nde1 tethers Lis1 to dynein and stimulates dynein motility.
a. AlphaFold2 prediction of Lis1 (purple) binding to Nde1 (orange: N-terminal, pink: C-terminal). b. Mass photometry profiles for Lis1 binding to Nde1. c. Schematics of single molecule colocalization assay. wtDyn was labeled with both biotin and Alexa488 and immobilized on a glass surface. 0.5 nM LD555-labeled Lis1 and different concentrations of unlabeled Nde1 were flown into the chamber for observation of Lis1 colocalization to surface-immobilized dynein. d. Percent colocalization of surface-immobilized dyneins with LD555-Lis1 under different concentrations of Nde1 (Left) and with LD655-Nde1 under different concentrations of Lis1 (Right). From left to right, N = 8, 10, 10, 11, 10, 5, 5, 5, and 5 imaging areas (40 µm x 40 µm) with at least 100 immobilized dynein spots. e. (Left) The inverse cumulative distribution function (1 - CDF) of Lis1 binding to dynein in the presence and absence of Nde1. (Right) Nde1 binding to dynein in the presence or absence of Lis1. Dashed curves represent a fit to an exponential decay to estimate the average residence time (±s.e.). f. Mass photometry profiles for Lis1 binding to Nde11–190. g. Representative kymographs show wtDDR motility with Nde1 or Nde11–190. h. The run frequency distribution of Nde1 and Nde11–190 under different Lis1 and Nde1 concentrations. Results were normalized to the 0 nM Lis1 and 0 nM Nde1 condition. From left to right, N = 14, 14, 10, 10, 10, 14, 10, and 10 microtubules. In b and f, solid curves represent a fit to multiple Gaussians to predict the average mass (Supplementary Table 2) and percentage of each population. In d and h, the center line and whiskers represent the mean and s.d., respectively. P values are calculated from a two-tailed t-test.

