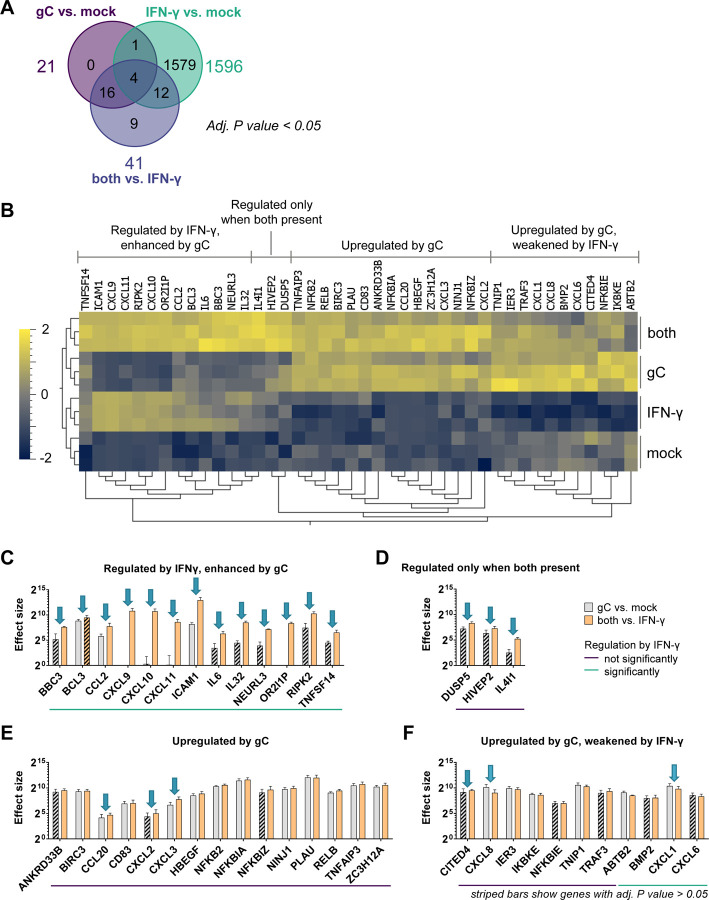
Figure 2. VZV gC induces biased IFN-γ-induced gene expression.
HaCaT cells were stimulated with IFN-γ, gCS147-V531, both or mock treated for 4 h. RNA was isolated and further processed for RNAseq. (A) Venn diagram showing the number of genes, whose expression was modified in a statistically significant manner (P value < 0.05) for the three depicted comparisons. Differential gene expression analysis was performed comparing the different treatment conditions. (B) Normalized counts of genes with an adjusted (adj.) P value < 0.05 for either the comparison ‘gC vs. mock’ or ‘both vs. IFN-γ’ were plotted as heatmap after calculating the log2 and normalising (mean = 0, variance = 1) using Qlucore Omics Explorer 3.8. Hierarchical clustering was applied to sort for genes with a similar behaviour among the treatment conditions. Genes were classified in four different groups based on their expression change upon stimulation with IFN-γ, gC or both. (C-F) Genes with an adj. P value < 0.05 for either the comparison ‘gC vs. mock’ or ‘both vs. IFN-γ’ were sorted into the four groups identified in the heatmap and the effect sizes were calculated and plotted. Arrows indicate genes that show more than a 1.5-fold change in their effect sizes between both comparisons. The coloured lines below the graphs indicate which genes were significantly regulated by IFN-γ alone. Striped bars indicate that the respective effect size was calculated from a not statistically significant regulated gene in that specific comparison. Panel (C) shows the genes regulated by IFN-γ and enhanced by gC. Panel (D) shows genes that were regulated when both were present. Panel (E) depicts genes mainly upregulated by gC alone and panel (F) includes genes that were upregulated by gC and weakened by IFN-γ.

