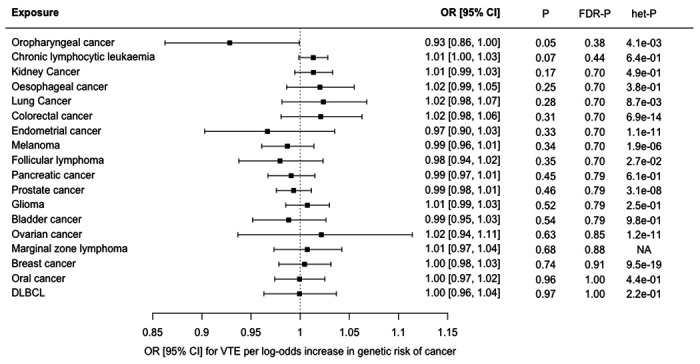
Figure 4.

Forest plot showing estimates from Mendelian randomisation (MR) estimates of the effect of genetic risk of 18 cancers as exposures on venous thromboembolism (VTE), as an outcome. The MR inverse variance weighted estimate is shown for all cancers except marginal zone lymphoma, where the Wald ratio is shown as only a single instrumental variable was available. Results are represented as the odds ratio (OR) and 95% confidence interval (CI) for VTE per log-odds increase in genetic risk of each cancer. Nominal P values (P), false discovery corrected P values (FDR-P) and heterogeneity P values for Cochrane’s Q statistic (het-P) are shown.
