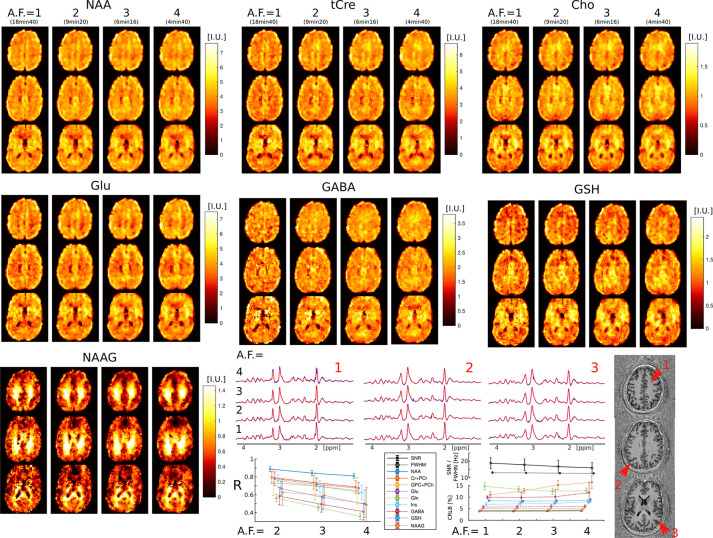
FIG. 3:
3D-ECCENTRIC 1H-FID-MRSI metabolic images of human brain in healthy volunteer with 3.4 mm isotropic voxel size and 1–4 CS acceleration factors. Top, metabolite maps of seven relevant brain metabolites (NAA, tCre, Cho, Glu, GABA, GSH, and NAAG) are shown for all acceleration factors (AF). Spectra from three brain locations indicated by red arrows on the anatomical image. At the bottom, the left plot displays the correlation coefficients between accelerated images and fully sampled images , while the right plots show the LCModel quantification error (CRLB), linewidth (FWHM), and SNR.

