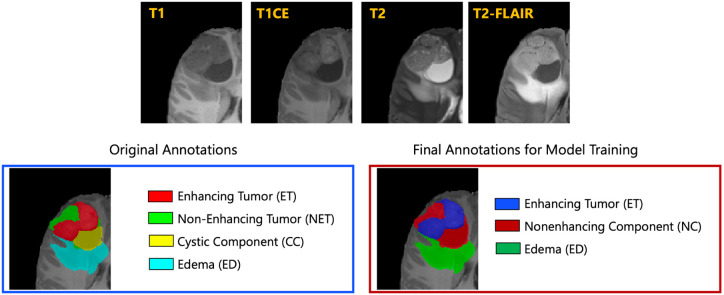
Fig.1: Illustrative example of tumor subregions in pediatric brain tumors.
Image panels with the annotated tumor subregions along with mpMRI structural scans (T1, T1CE, T2, and T2-FLAIR). The left-most side image on the bottom panel with the overlaid annotations showcases the original tumor subregions, i.e., enhancing tumor (ET - red), non-enhancing tumor (NET - green), cystic component (CC - yellow), and edema (ED - teal). The image on the right hand side of the bottom panel with the overlaid annotations on the T2 sequence demonstrates the tumor subregions provided to the BraTS-PEDs 2023 participants: enhancing tumor (ET), nonenhancing component (NC), and edema (ED) [3].

