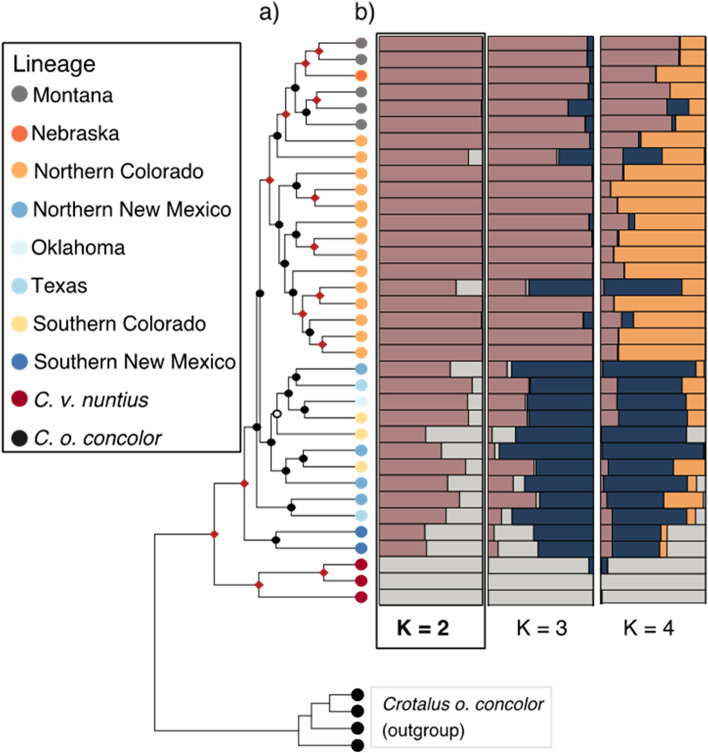
Fig. 4.
a Bayesian phylogeny generated from all nuclear SNPs in BEAST (n = 35). Nodes with > 0.95 posterior support are denoted with red diamonds. For nodes with less support, nodes are labeled with closed circles if posterior support is above 0.50 and open circles for nodes with posterior support below 0.50. b Mosaic plots from STRUCTURE results using all 35 samples from the nuclear dataset run from K = 2–4, where K = 2 was provided greatest support. Colored bars indicate the proportion of SNPs associated with each identified cluster. Note that mosaic plots and the nuclear phylogeny are aligned by sample

