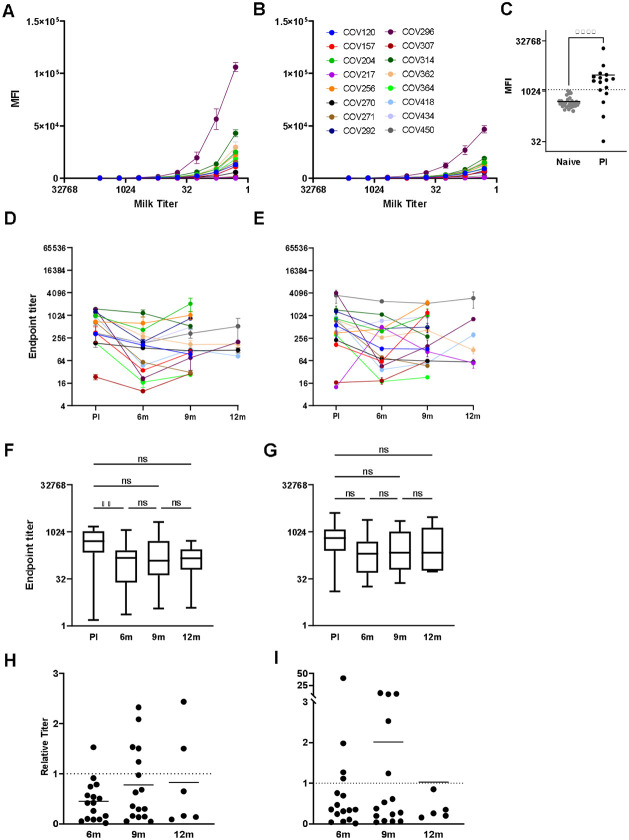
Figure 2. Longitudinal human milk IgA and sAb against SARS-CoV-2 Nucleocapsid are maintained less consistently compared to Spike Abs and subject to significant background reactivity.
(A-C) Titration curves of IgA and sAb 3-8 weeks post-infection. A) IgA; B) sAb, C) high background IgA of COVID-19-naïve milk hinders determination of a positive cutoff value. MFI at 1/18 dilution (screening dilution) are shown. (D-E) Individual endpoint titers over time. D) IgA, E) sAb. (F-G) Grouped endpoint titers with mean values and ANOVA analysis for change over time. F) IgA, G) sAb. Relative endpoint titers over time compared to 3-8 weeks post-infection. H) IgA, I) sAb. Dotted line indicates relative titer of 1, meaning no change. PI: post-infection.

