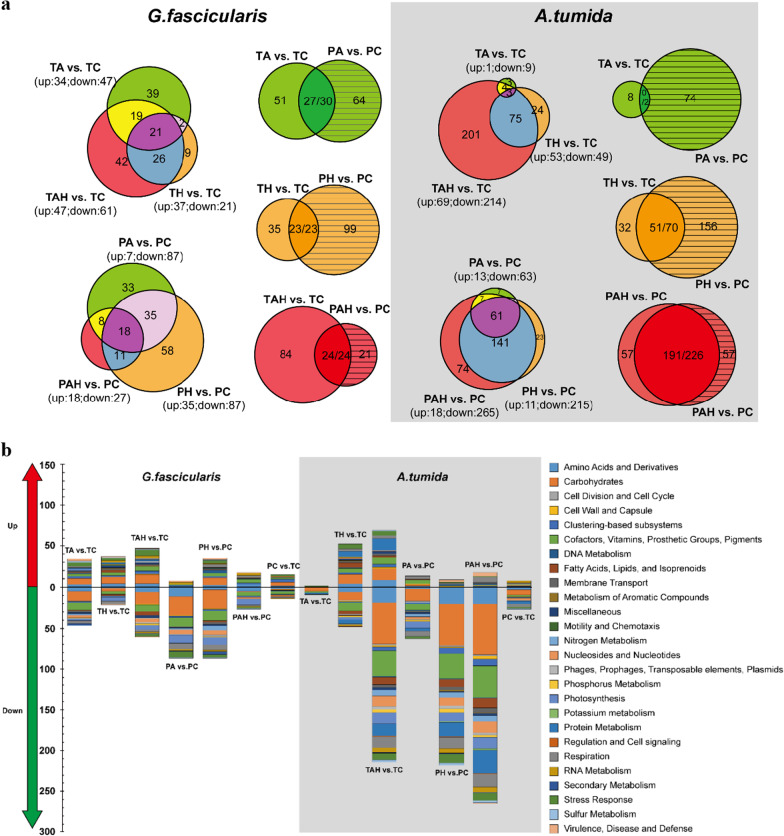
Fig. 4.
The DEGs analysis under (T) and after (P) warming (H), acidification (A) and warming-acidificaion (AH). a Venn diagram indicates the total DEGs number from each group and the overlapping areas based on and sampling time form each coral. The number separated by/indicates consistent expressed and total DGEs between T and P within some treatment. b Summary of the DGEs in each treatment. Genes are categorized by the level 1of the SEED Subsystems. T: under stress; P: after stress; A: acidification; H: warming; AH: acidification–warming

