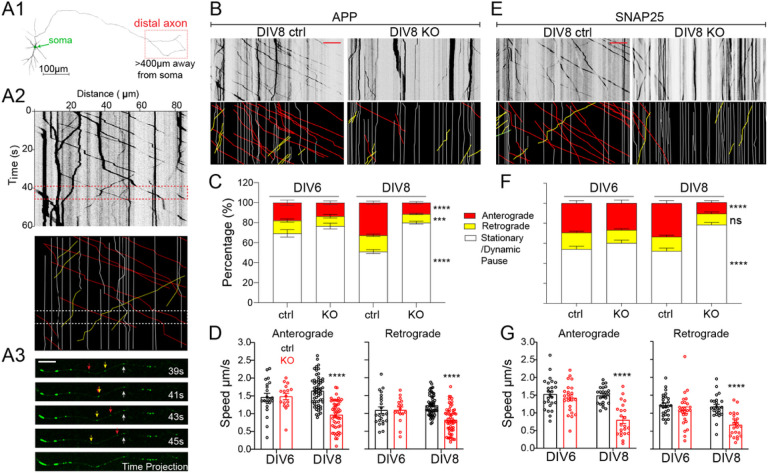
Figure 3. Nmnat2 is required for transporting vesicular cargos in the distal axon.
(A1) Diagram indicating the distal axon region (> 400 μm from the soma) where axonal transport was examined with time-lapse imaging. (A2) Example kymograph (upper) and annotations (lower) with anterograde (red lines), retrograde (yellow lines), and stationary/dynamic pause (white lines) movements indicated. (A3) Four image examples showing APP-EGFP movement along an axon segment during the times indicated in the dashed box in A2. Scale bar, 10 μm. (B, E)Representative kymographs for APP-EGFP and SNAP25-EGFP from DIV8 ctrl and KO distal axons. Scale bar, 20 μm. (C, F) Percentages of APP- or SNAP25-EGFP vesicles moving antero/retrogradely or staying stationary/dynamic pause in ctrl and KO neurons. Numbers (neurons imaged) and statistics: (C)DIV6, 22 ctrl, and 19 KO; DIV8, 56 ctrl, and 62 KO; compared with two-way ANOVA and Šídák’s multiple comparisons for anterograde and stationary/dynamic pause categories, compared with multiple Mann-Whitney test and Holm-Šídák multiple comparisons for the retrograde category. (F)DIV6, 27 ctrl, 26 KO; DIV8, 24 ctrl, 27 KO; two-way ANOVA with Tukey’s multiple comparisons. (D, G) Velocity of antero- and retrograde transport in ctrl and KO neurons from 2–3 independent experiments. Numbers (neurons imaged) and statistics: (D) Anterograde velocity analysis: DIV6, 21 ctrl and 16 KO; DIV8, 56 ctrl and 51 KO. Retrograde velocity analysis: DIV6: 22 ctrl, 16 KO; DIV8, 56 ctrl, 58 KO. Two-way ANOVA with Šídák’s multiple comparisons. (G) Anterograde velocity analysis: DIV6, 25 ctrl, 24 KO; DIV8, 24 ctrl, 22 KO; two-way ANOVA with Tukey’s multiple comparisons. Retrograde velocity analysis: DIV6, 25 ctrl, 26 KO; DIV8, 24 ctrl, 23 KO; multiple Mann-Whitney test with Holm-Šídák multiple comparisons. KO was compared to ctrl of the same DIV in all data sets. Data represent mean ± SEM, ****p<0.0001. APP and SNAP25 data were collected from 3 and 2 independent experiments, respectively.

