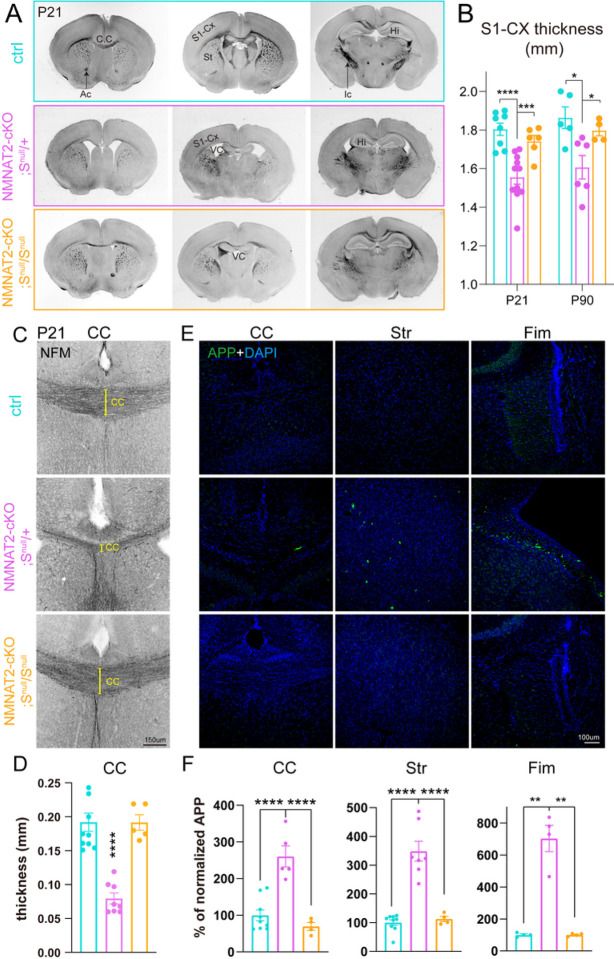
Figure 7. Deleting SARM1 prevents neurodegenerative phenotypes in NMNAT2 cKO brains.
(A) Bright field images of coronal brain sections (rostral to caudal from left to right) from ctrl, NMNAT2 cKO; Snull/+, and NMNAT2 cKO; Snull/Snull mice. Enlarged ventricle, greatly reduced corpus callosum, and internal capsule were evident in NMNAT2 cKO; Snull/+ but not in NMNAT2 cKO; Snull/Snull brains. (B) Thickness of the primary somatosensory cortex in P16/21 and P90 mice. Number of mice: P16/21, 8 ctrl, 11 NMNAT2 cKO; Snull/+, 6 NMNAT2 cKO; Snull/Snull; P90, 5 ctrl, 6 NMNAT2 cKO; Snull/+, 4 NMNAT2 cKO; Snull/Snull. ***, p=0.0018, q=0.0009. (Ctrl vs. NMNAT2 cKO; Snull/+) *, p= 0.0049, q= 0.0103. (NMNAT2 cKO; Snull/+ vs. NMNAT2 cKO; Snull/Snull) *, p= 0.0341, q= 0.0358. (C) Representative NF-M (black) immunostaining images showing corpus callosum around the midline area in ctrl, NMNAT2 cKO; Snull/+, and NMNAT2 cKO; Snull/Snull rostral brain section at P21. (D) CC thickness quantification. Number of mice: P21, 10 ctrl, 8 NMNAT2 cKO; Snull/+, 5 NMNAT2 cKO; Snull/Snull. (E) Immunohistology images showing APP accumulation in the corpus callosum, fimbria, and striatum of P21 NMNAT2 cKO; Snull/+, but not in ctrl and NMNAT2 cKO; Snull/Snull brains. (F) Quantification of the APP signal in the brain regions shown in (E) normalized to the value in ctrl mice. Number of mice: 7–9 ctrl, 4–5 NMNAT2 cKO; Snull/+, 4 NMNAT2 cKO; Snull/Snull. CC, corpus callosum; Str, striatum; Fim, Fimbria. (Fim Ctrl vs. NMNAT2 cKO; Snull/+) **, p=0.0186, q= 0.0098. (NMNAT2 cKO; Snull/+ vs. NMNAT2 cKO; Snull/Snull) **, p=0.0186, q=0.0098. All above data represent mean ± SEM. One-way ANOVA with a two-stage linear step-up procedure of Benjamini, Krieger, and Yekutieli was used, ****p<0.0001.

