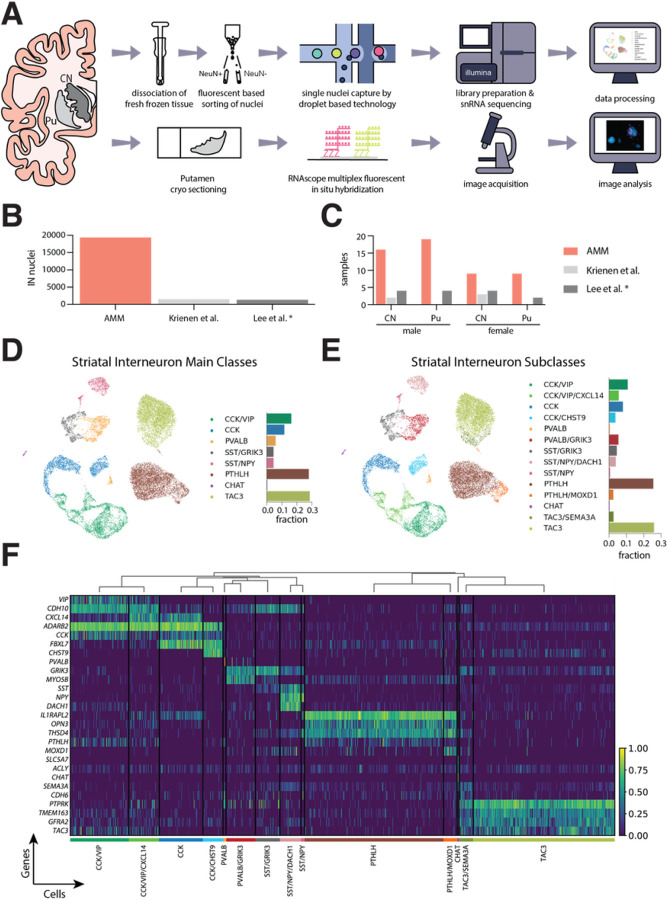
Figure 1. Interneuron heterogeneity of the human striatum determined by single–nucleus RNA-sequencing.
A. Schematic overview of the experimental design. B. Number of interneuron nuclei sequenced in the present study (labeled as AMM) vs. two other previous works. C.Number of human samples included in this study (AMM) vs. two previous works. D. UMAP projection of the snRNA-seq data of the nuclei labeled as interneurons, colored by class. The barplot next to the UMAP indicates the fraction of all interneuron nuclei represented by each class. E. UMAP projection of the interneuron nuclei colored by subclass. The barplot indicates the fraction of each subclass over all interneuron nuclei. F. Heatmap showing the expression of selected marker genes for each of the fourteen interneuron subclasses identified. The expression of each gene is normalized by its maximum value across all nuclei. The dendrogram above the heatmap indicates the proximity across subclasses based on the average Pearson correlation coefficient across all genes between each pair of subclasses. * Note that only the samples from control donors are shown in here from Leés study. CN, caudate nucleus; IN, interneuron; Pu, putamen

