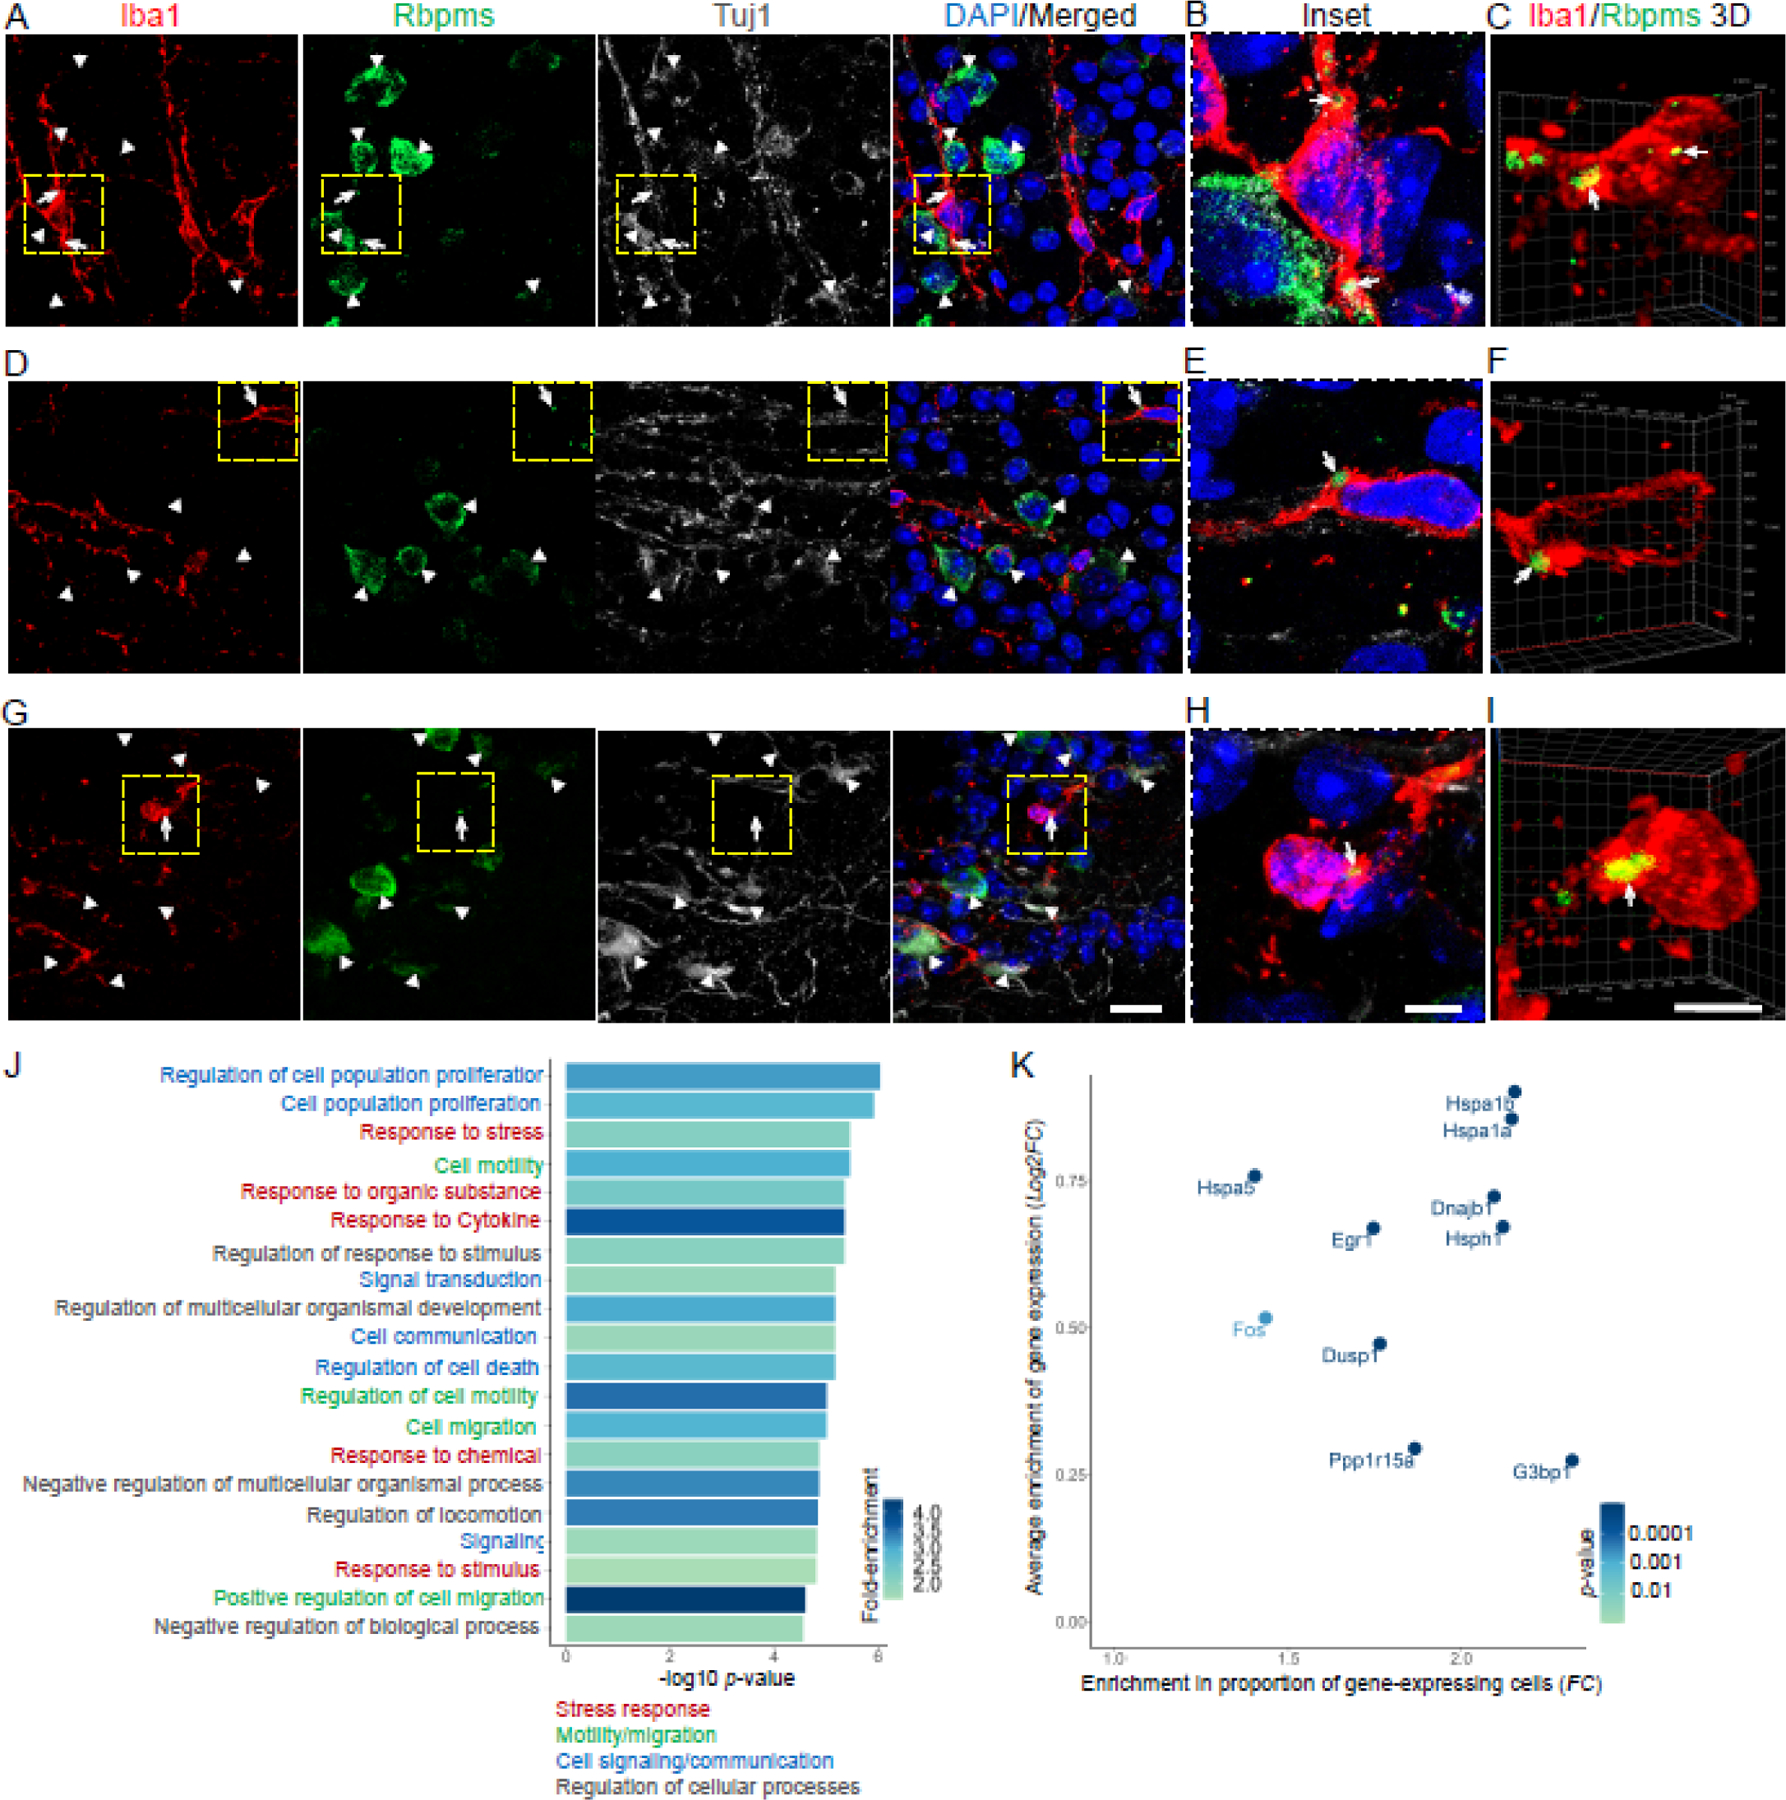
Figure 3. Rbpms protein localizes to stress granules in a subpopulation of retinal microglia/macrophages which are enriched for stress response genes after optic nerve injury.

(A-I) Confocal images of the retinal flatmounts (at 2 weeks after ONC) co-immunostained for Rbpms, Iba1, Tuj1, and counterstained for DAPI (to label nuclei), show examples of Rbpms signal localization to granules in Iba1-labled microglia/macrophages, as compared to diffuse cytoplasmic Rbpms signal in Tuj1-labled RGCs, in the injured retinas’ GCL. White arrowheads indicate Rbpms+/Tuj1+ RGCs. White arrows indicate Rbpms+ granules within the Iba1+ microglia/macrophages. Dashed yellow-line outlined regions in the main panels (A,D,G) are shown in insets (B,E,H) and in 3D renderings (C,F,I) at higher magnification for better visualization of the Rbpms+ granules’ subcellular localization within the Iba1+ microglia/macrophages. Main panels scale bar: 20 µm; insets and 3D panels scale bars: 5 µm.
(J) Gene ontology (GO) analysis of genes enriched in Rbpms+ relative to Rbpms− microglia/macrophages identified GO biological processes (GO:BPs; 20 topmost significant by adjusted p-value are shown) that included multiple cellular stress response-related terms. Further functional annotation and semantic similarity clustering of GO:Terms (using the EnrichPlot R package) identified 4 overarching enriched pathways, which included “stress response”. GO:BPs are color-coded according to overarching enriched pathways to which they belong, as marked. Color scale bar indicates GO:BP terms’ fold-change (FC) enrichment (see Methods).
(K) Enrichment of stress granule-associated genes in the Rbpms+ relative to Rbpms− microglia/macrophages is demonstrated by higher average expression of these genes (y-axis; log2 FC) and by higher proportion of Rbpms+ cells as compared to Rbpms− cells expressing these genes (x-axis; FC). Color scale bar indicates significance of average expression enrichment (adjusted p-value by Wilcoxon rank-sum test; see Methods).
