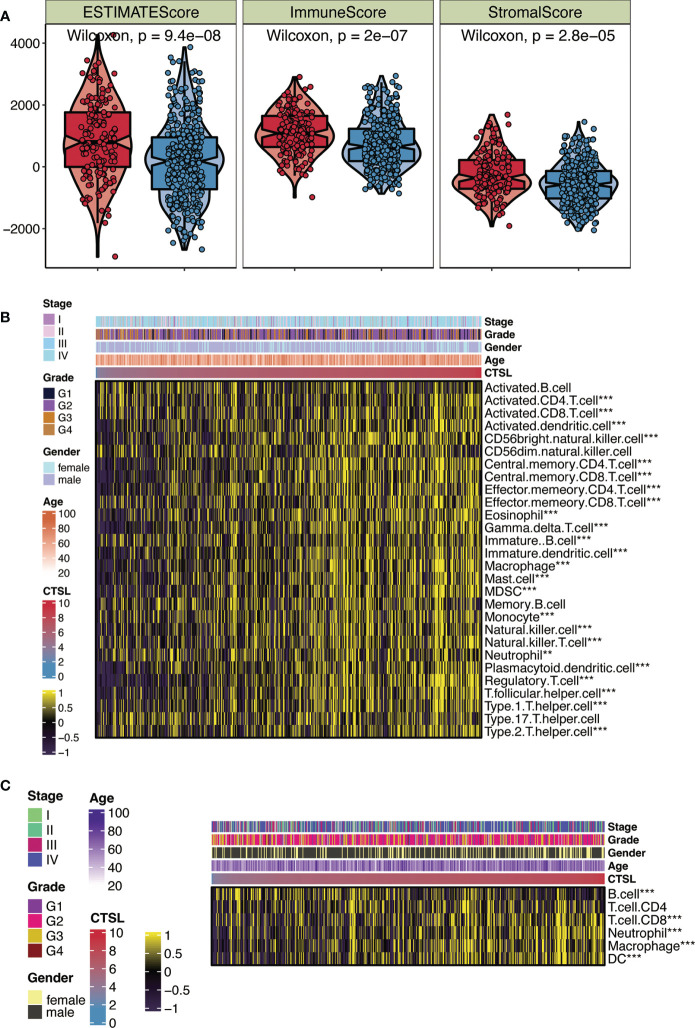
Figure 2.
CTSL expression in relation to immunity in the TCGA cohort. (A) Changes in ESTIMATE among HNSCC patients with high and low CTSL expression. (B) Heatmap showing the abundance of infiltrating immune cell populations for different CTSL expression according tossGSEA algorithms. (C) Heatmap showing the abundance of infiltrating immune cell populations for different CTSL expression according to TIMER algorithms. **, p<0.005; ***, p<0.001.

