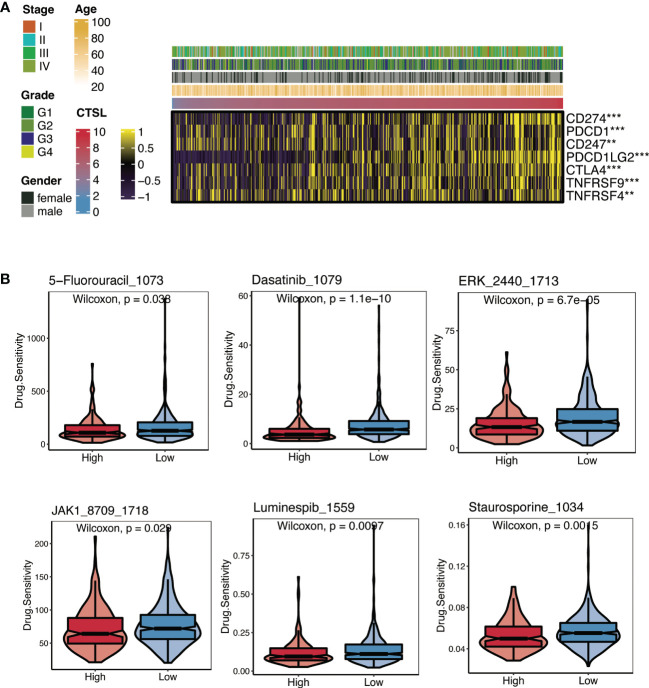
Figure 3.
Immunotherapy and chemotherapy of CTSL expression involved in TCGA-HNSCC. (A) Correlation of CTSL expression and immune checkpoint levels in HNSCC. (B) Boxplots of estimated drug sensitivities for several GDSC chemotherapeutics in the high and low CTSL expression groups. **, p<0.005; ***, p<0.001.

