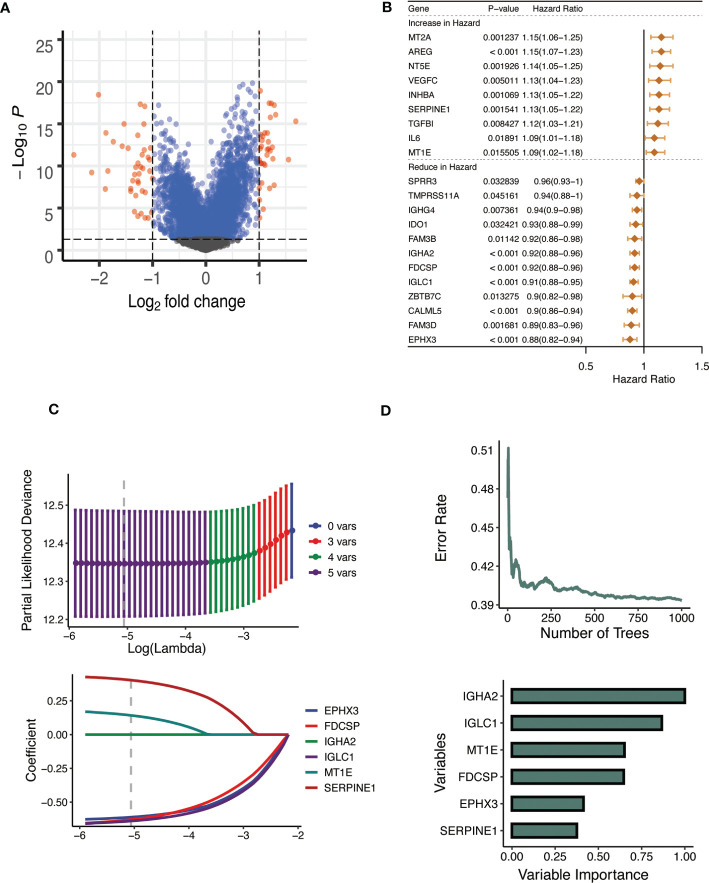
Figure 5.
Establishment of the CTSL signature. (A) Volcano plot showing the results of the analysis of differences between high and low CTSL groups. (B) Univariate Cox analysis forest plot of 21 prognosis-related to CTSL. (C) Machine learning method for survival random forest to further screen CTSL signature). (D) Lasso regression method to calculate CTSL signature.

