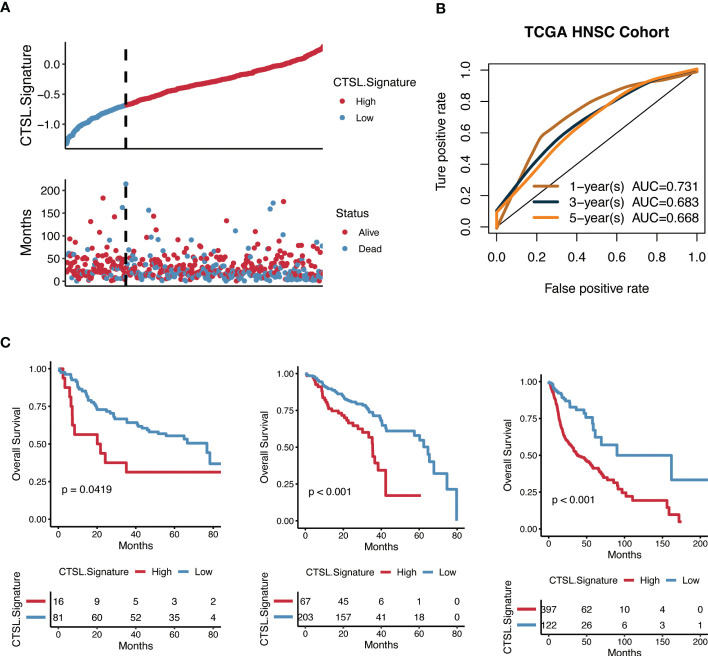
Figure 6.
Predictive potential of the CTSL signature for prognosis in HNSCC patients. (A) Kaplan–Meier curves of high and low CTSL signature in TCGA-HNSCC. (B) Time-dependent ROC of CTSL signature in TCGA. (C) Kaplan–Meier curves of overall survival in HNSCC patients based on external validation datasets (GSE41613, GSE65858, and TCGA).

