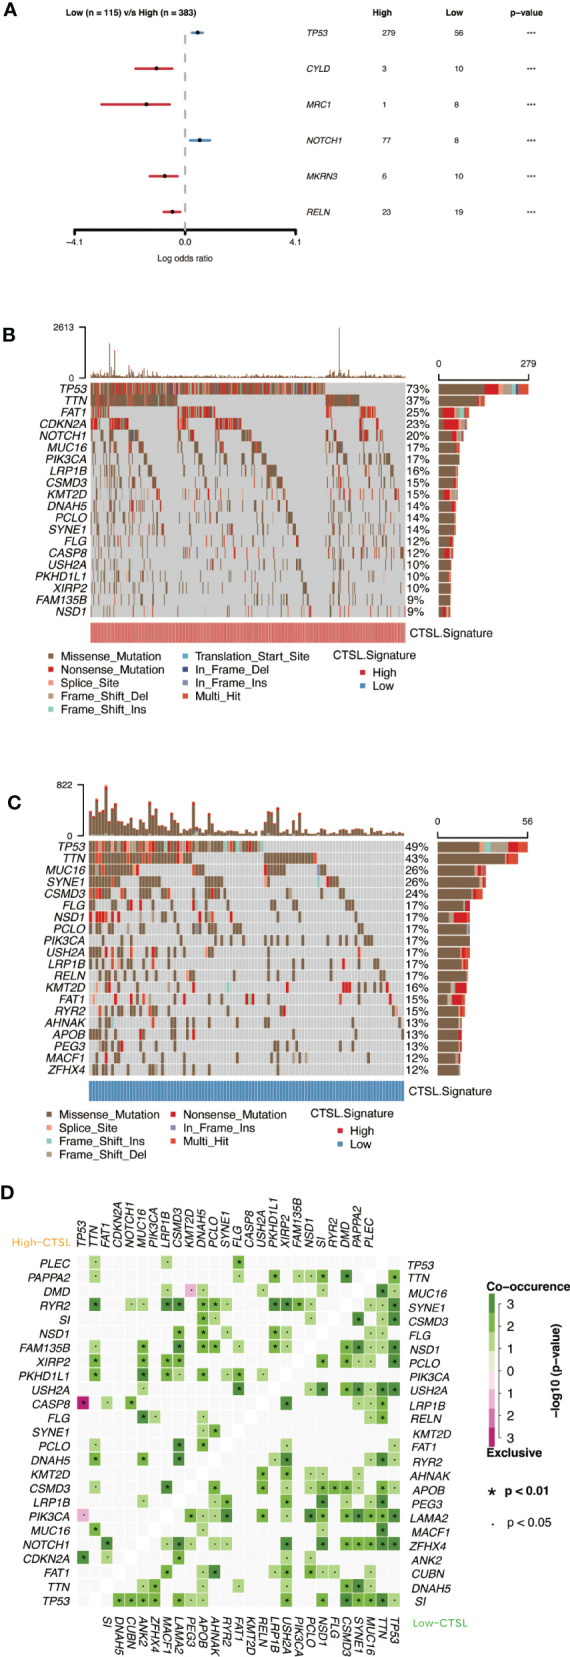
Figure 7.

Genomic alterations associated with CTSL signature in HNSCC samples. (A) Forest plot showing the results of somatic mutation difference analysis between high and low groups of CTSL signature. (B, C) oncoplot of somatic mutations in HNSCCs between high and low CTSL signature groups. (D) The heatmap presents the somatic interaction of HNSCCs between CTSL signature high and low groups.
