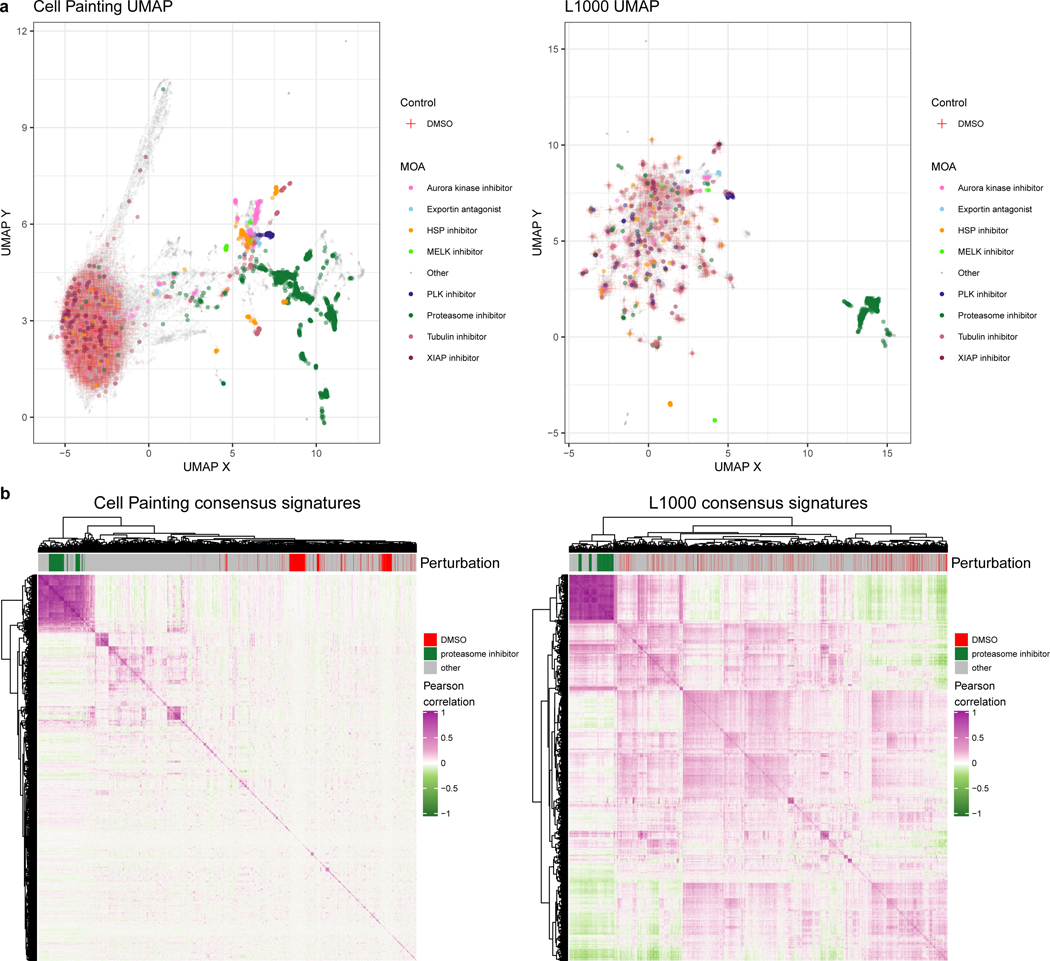
Figure 2. Cell Painting captures a more diverse sample space than L1000.

(a) Uniform manifold approximation (UMAP) coordinates of all perturbations (level 4 replicates) across all doses by Cell Painting (left) and L1000 profiles (right). We highlight select MOAs that are consistently different from DMSO controls in either modality. Note that Cell Painting data is spherized and L1000 data is not, as explained in the main text; here this manifests in quite different patterns for the negative control DMSO samples. In particular, many of the otherwise-distinct islands of compounds for L1000 are populated by negative control DMSO. (b) Heatmaps of pairwise Pearson correlations of all measured compounds’ consensus signatures (see Methods) in either assay at the highest dose (10 μM) plus positive-control proteasome inhibitors at 20 μM and DMSO negative controls.
