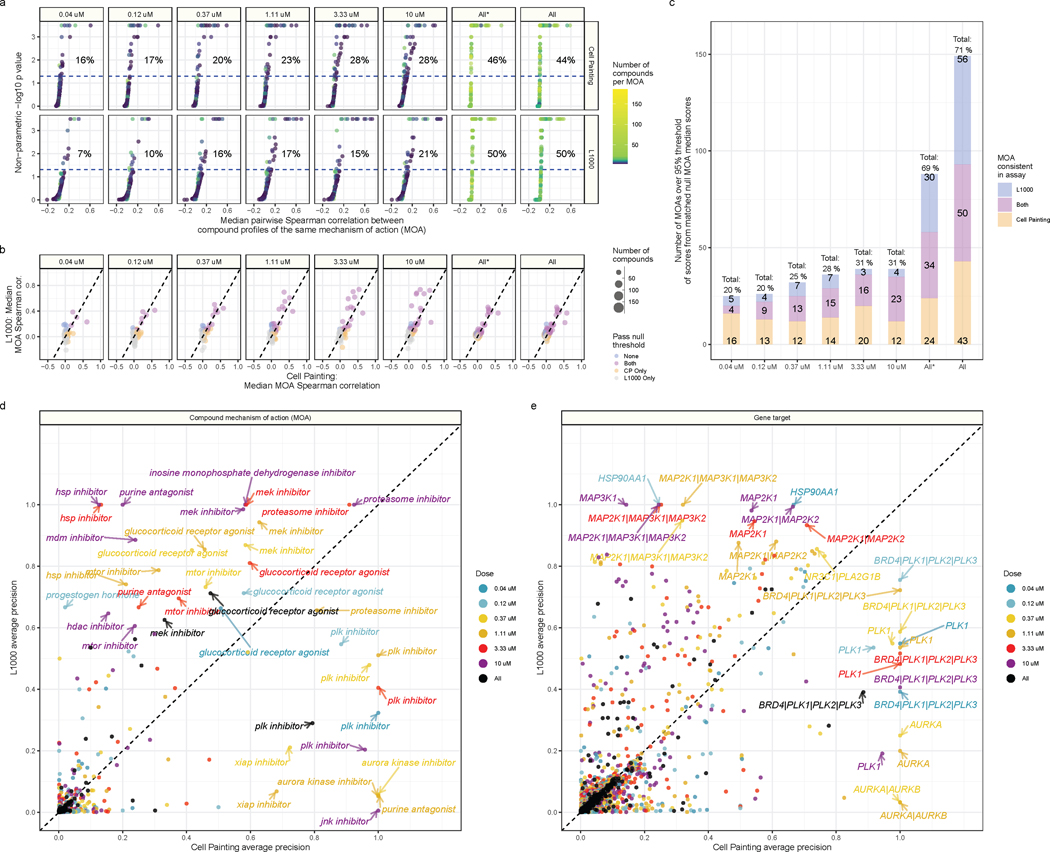
Figure 4. Cell Painting and L1000 differentially measure compound perturbations by mechanism of action (MOA).
(a) Percent matching metrics for median pairwise replicate correlations of groups of compounds with a given MOA annotation, measured in both assays and across doses. The color of the point represents how many compounds were annotated to a given MOA class. (b) Median correlation between compounds annotated with the same MOA. We derived the null threshold through a nonparametric permutation test of randomly sampled compounds (see Methods). The size of the points represent how many compounds belong to the MOA class. (c) The L1000 and Cell Painting assays reproducibly measure a complementary set of MOAs. The three numbers represent (from top to bottom) the number of MOAs unique to L1000, the number of MOAs captured in both assays, and the number of MOAs unique to Cell Painting that have higher signal than a randomly permuted null distribution control. The All* bar represents matched MOAs for the 127 MOA set and the All bar represents matched MOAs for the 210 MOA set. Average precision of Cell Painting and L1000 compounds with different (d) MOA and (e) gene target annotations. We highlight certain high performing MOAs and targets.

