
Figure 2.
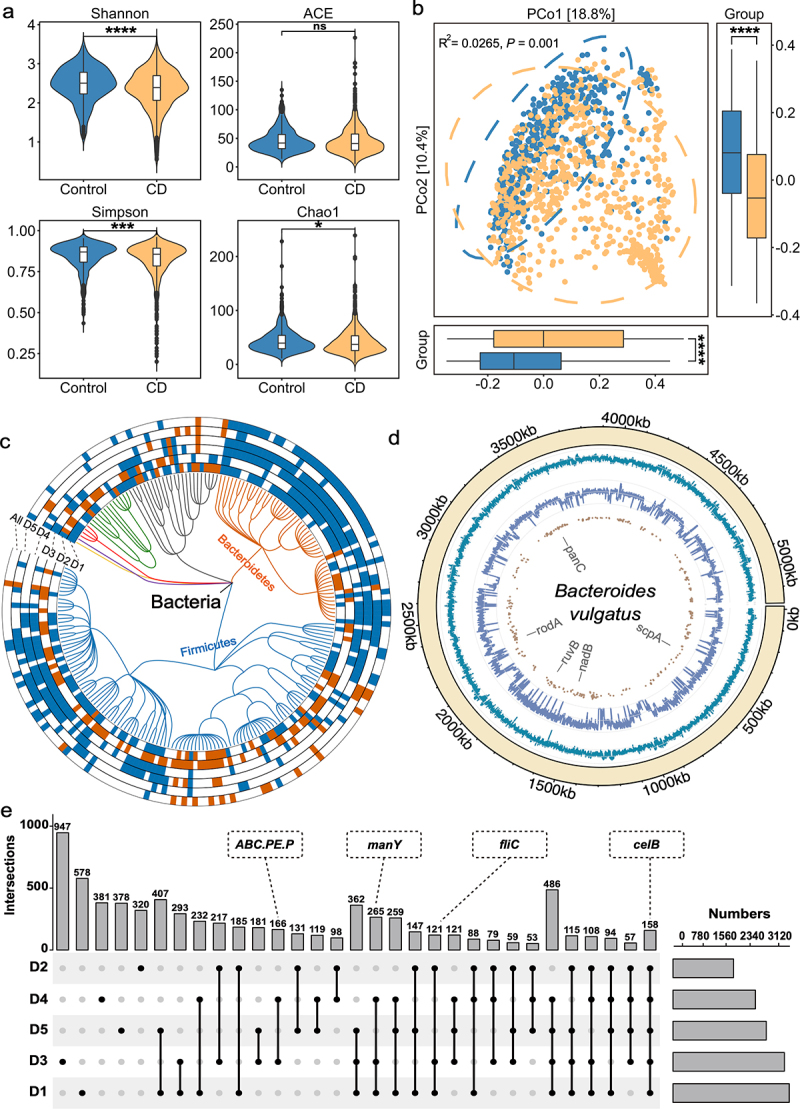
Multidimensional alterations in the gut microbiome of CD patients at species-, gene- and SNV-levels. (a) Alpha diversity measured by Shannon, ACE, Simpson and Chao1 index of patients with CD (orange, n = 785) and control individuals (blue, n = 456); *P < 0.05, **P < 0.01, ***P < 0.001 and ****P < 0.0001. (b) Principal coordinate analysis (PCoA) of samples from all five cohorts based on Bray–Curtis distance, which shows that microbial compositions were different between groups (R2 = 0.0265, P = 0.001). P values were calculated by 999 permutations (two-sided test). (c) Phylogenetic tree showing the differential bacteria species, grouped by the phyla. The differential species in each dataset are shown in each circle ‘D1-D5’ (P < 0.05, two-sided test); the meta-analysis results in integrated dataset were marked by ‘All’. Increased and decreased abundances are indicated by red and blue, respectively. (d) the chord diagram shows the distributions of annotated SNVs in Bacteroides vulgatus genome. The outer circle represents the genome of B. vulgatus; the inner circles represent the GC-content (cyan indigo lines), sequencing depth (purple lines) and sites of differential SNVs (brown points) in the genome, respectively. (e) UpSet plot showing the number of differential KO genes identified via MaAsLin2 in each dataset and those shared by the datasets. The number above each column represents the intersection size of differential KO genes. The connected dots represent the common differential genes across connected cohorts. The set size on the right represents the number of differential genes in each cohort.