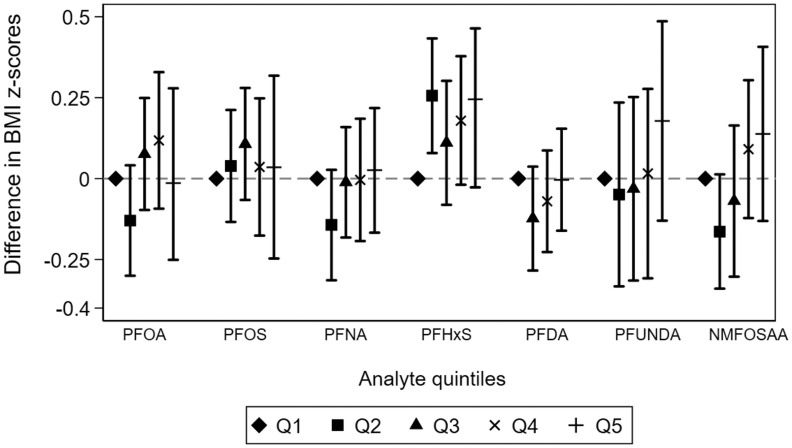
Figure 3.
Adjusted difference in child BMI -score across quintiles of PFAS concentrations during pregnancy: the ECHO Cohorts. Models were adjusted for sex of the child (2 categories), child age, maternal race (3 categories), maternal Hispanic ethnicity (2 categories), maternal age at delivery, highest level of maternal education at pregnancy (4 categories), and maternal prepregnancy BMI. Models included random intercepts for participant and cohort. Cutoffs for quintiles and the full corresponding numerical results in this figure are presented in Table S11. Shapes show the reference, and point estimates for the difference in BMI- scores for each quintile of PFAS analyte. Error bars represent the lower and upper confidence intervals for each point estimate. Quintile 1 is the reference group for each analyte. Note: BMI, body mass index; ECHO, Environmental influences on Child Health Outcomes; NMFOSAA, -methyl perfluorooctane sulfonamido acetic acid; PFAS, per- and polyfluoroalkyl substances; PFDA, perfluorodecanoic acid; PFHxS, perfluorohexane sulfonic acid; PFNA, perfluorononanoic acid; PFOA, perfluorooctanoic acid; PFOS, perfluorooctanesulfonic acid; PFUnDA, perfluroundecanoic acid; Q, quintile.

