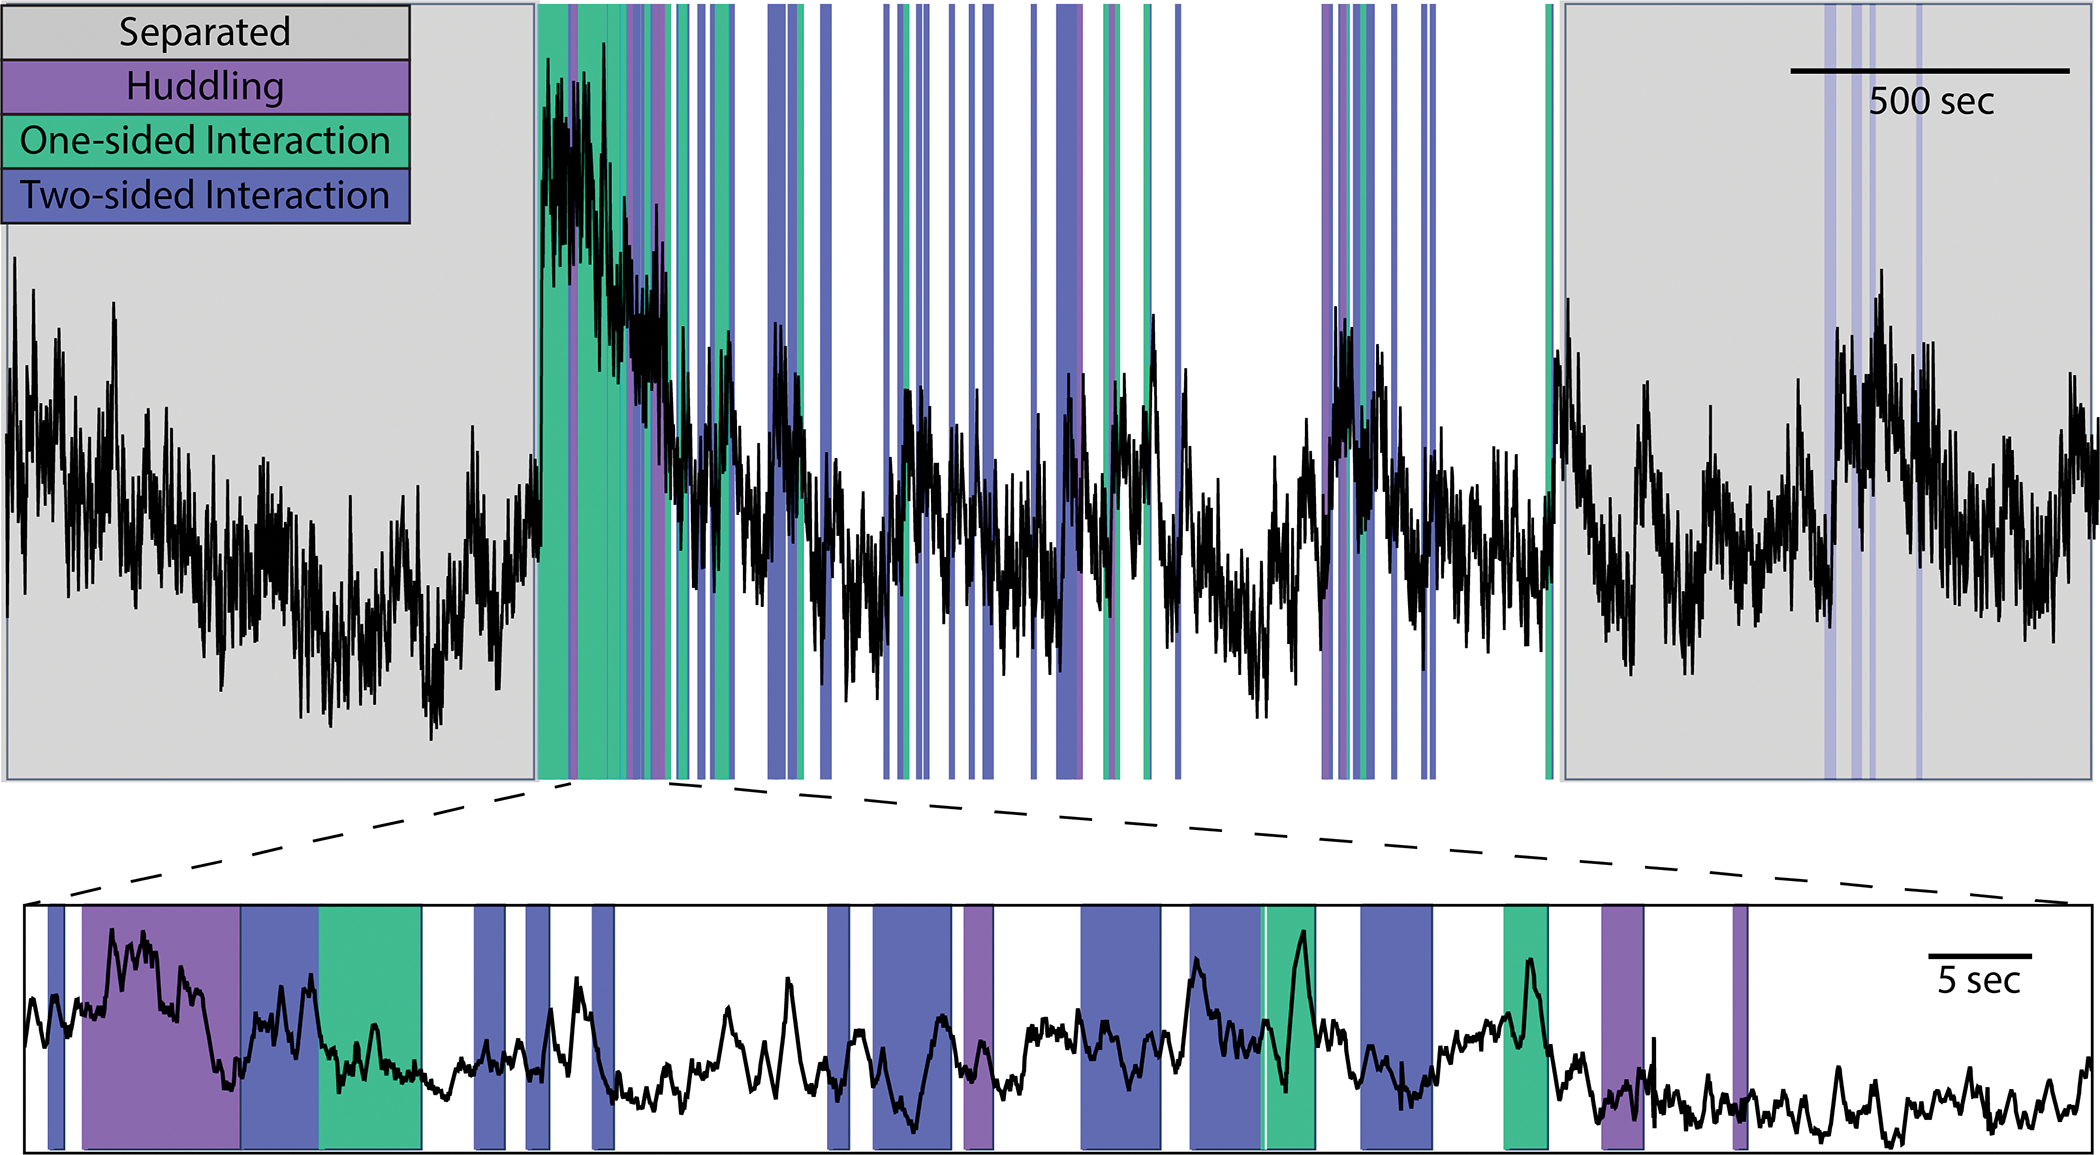
Figure 5. Example behavior plot generated by PhAT.

PhAT’s plot behavior card allows you to visually represent any event data (colors) over your photometry traces (black). The interactive graphs allow the user to zoom in on regions of interest on the trace (a shown on bottom) to visually examine data and look for oddities and patterns before determining the best analysis strategies.
