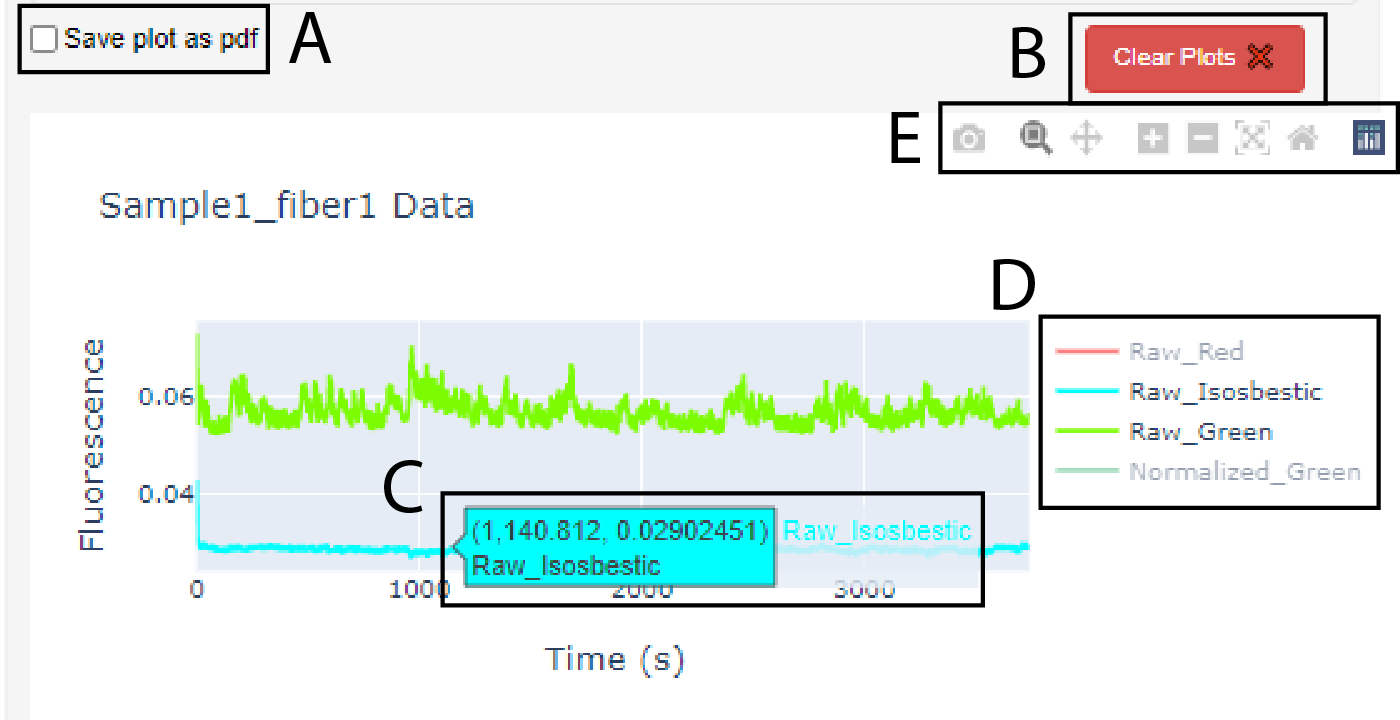
Figure 8. The graphs produced in PhAT are interactive.

A. Checkbox widget used to save a graph as a pdf. Note: it must be checked before creating the graph. B. Clear plots widget used to delete the oldest/top graph in the corresponding card. C. Dialog box that appears when cursor hovers over a trace; values indicate x- and y-values for the trace at the cursor location. D. Graph Legend. E. Graph toolbar.
