
Extended Data Fig. 4 |. Differential abundance analysis reveals relationship of baseline gut microbial taxa with high vs. low neutrophil-lymphocyte ratio in Pittsburgh early sample cohort.
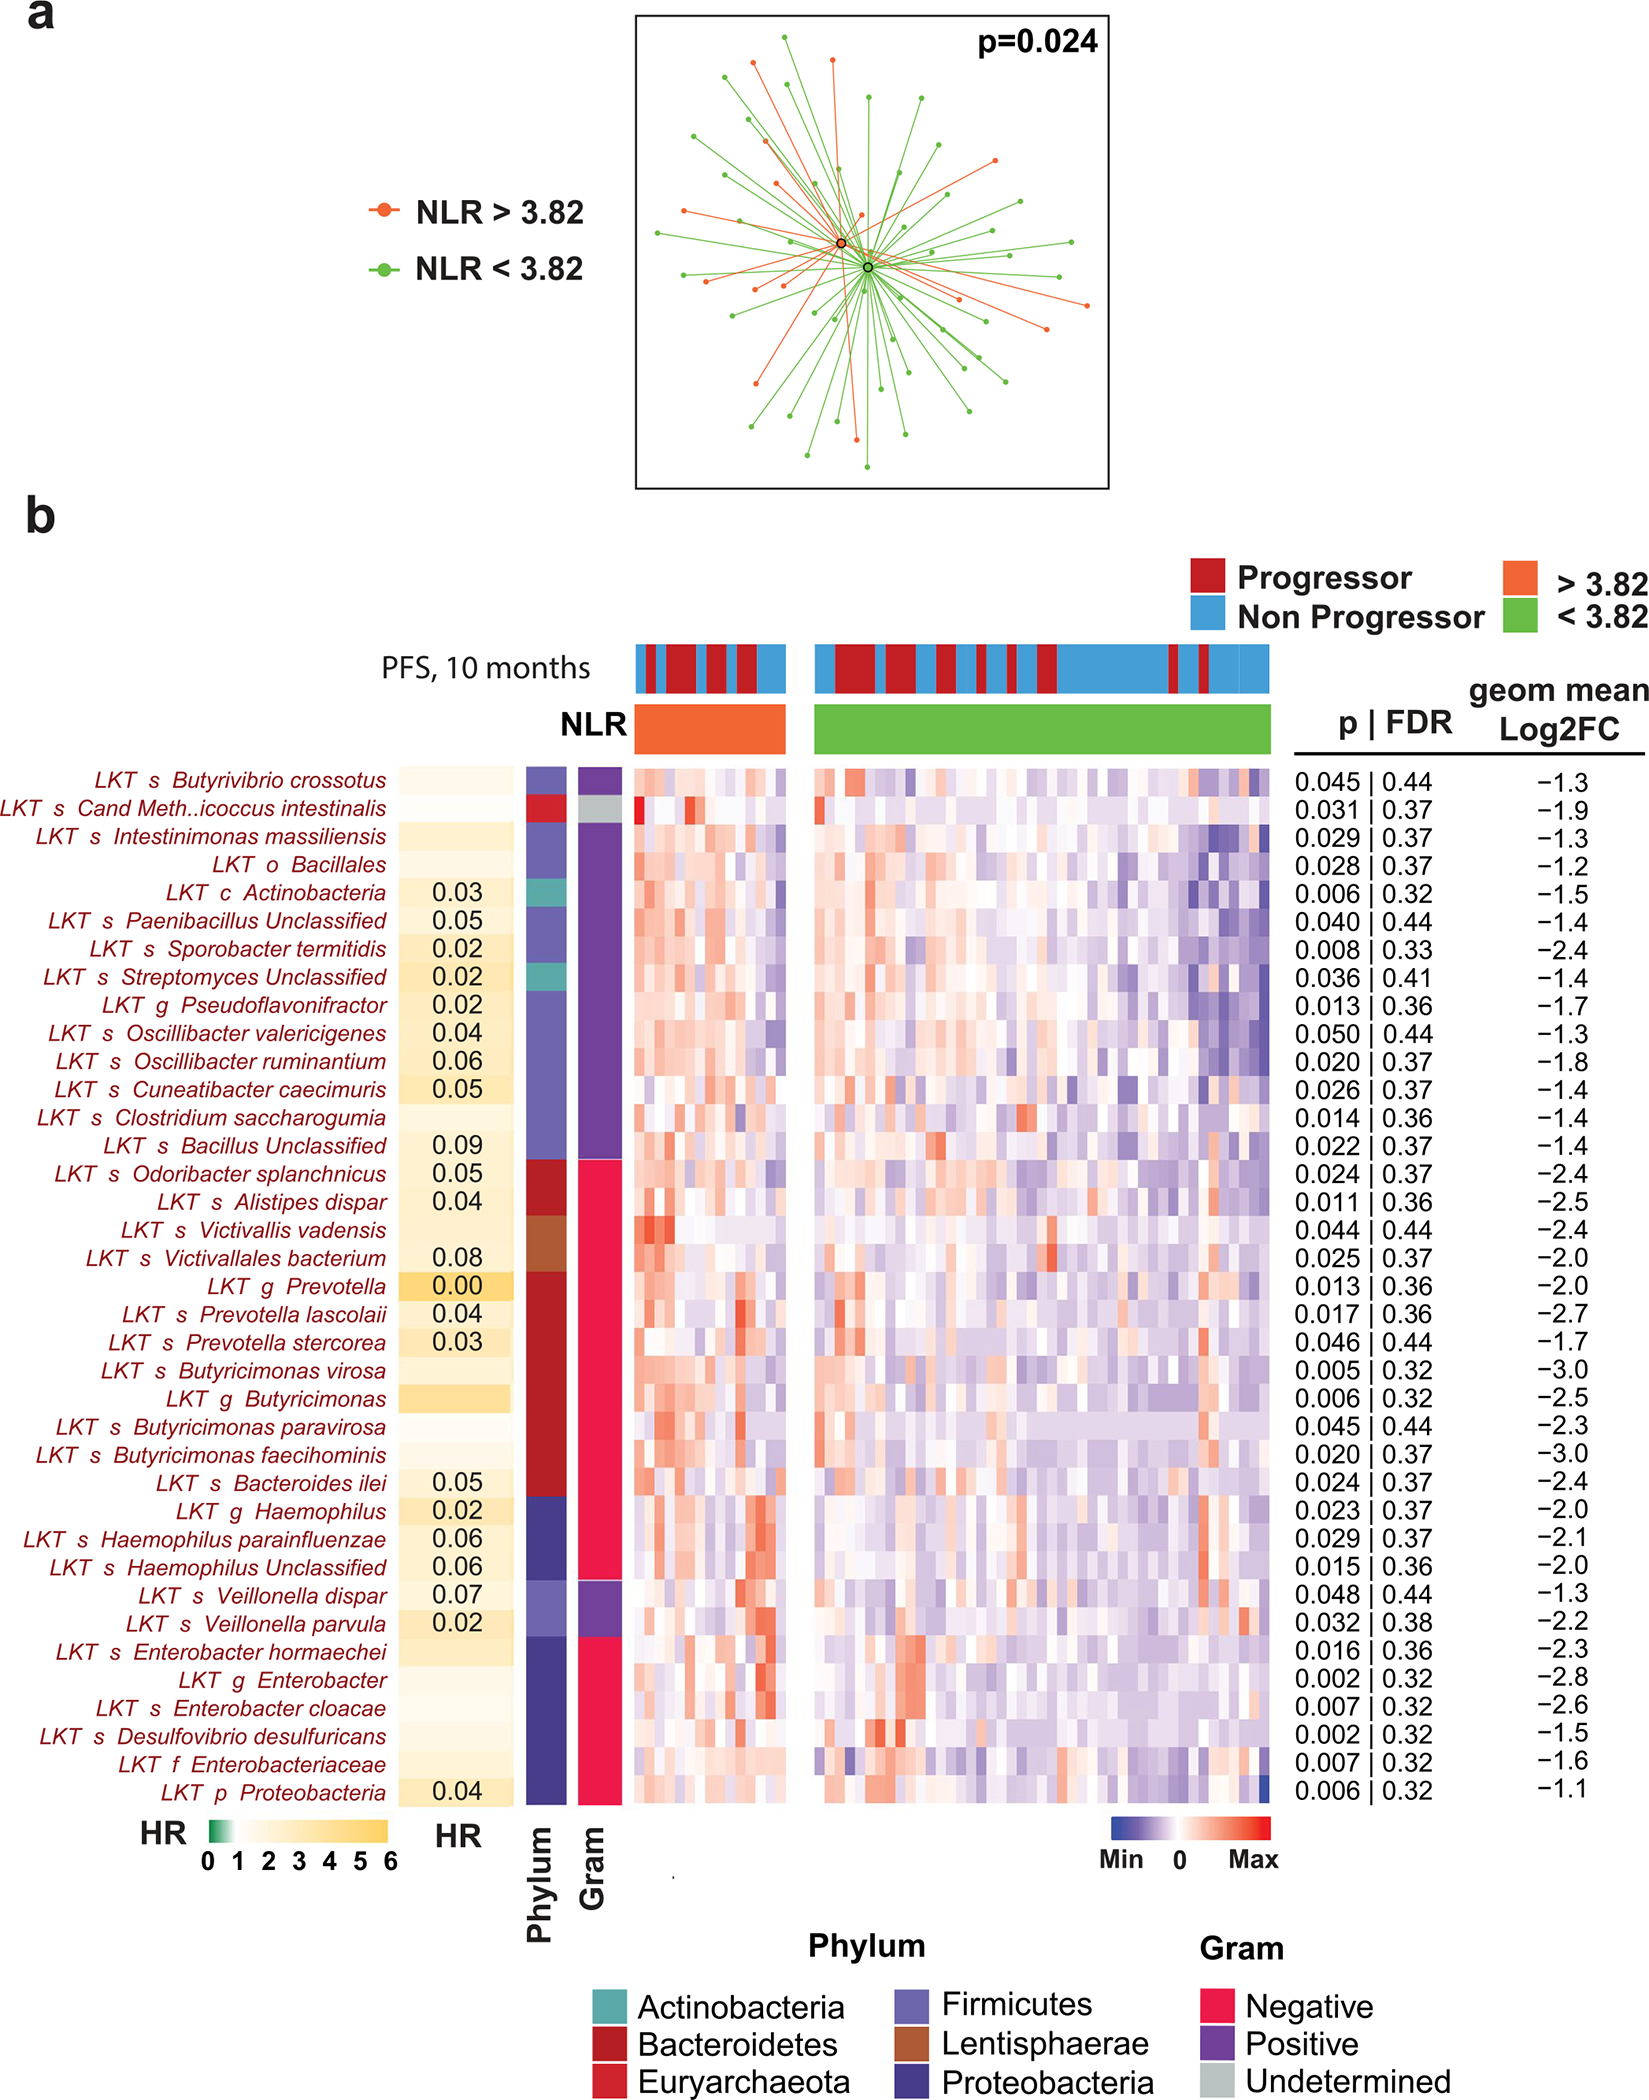
a. t-distributed uniform manifold approximation and projection (t-UMAP) plots depicting fecal microbiota compositional differences between patient groups with high (≥3.82; orange) and low (<3.82; green) pre-treatment neutrophil-lymphocyte ratio (NLR). Optimal cutoff for NLR (3.82) was determined by time serial PERMANOVA as shown in Fig. 1a. Two-tailed p-value was calculated using PERMANOVA. b. Heatmap of differentially abundant taxa (p < 0.05 and FC > 2) in high-pre-treatment NLR (orange) and low-NLR (green) patients, using optimal cutoff (3.82). Columns denote patients grouped by NLR status and clustered within each group; rows denote bacterial taxa enriched (red) in patients with high NLR clustered based on microbiota composition; no bacterial taxa significantly enriched in the low-NLR patients were identified. Statistical significance was calculated using two tailed Mann-Whitney U test. Bar plot to left of heatmap indicates extent of association between corresponding taxa and PFS probability [scaled hazard ratio (HR)] with Storey’s q-values <0.1 displayed within cells. Proportion of Gram-negative bacteria among those associated with high NLR was 58%, significantly higher than the average proportion of Gram-negative in patients’ fecal microbiome (28%, Chi-squared p = 0.0004).