
Fig. 5 |. Machine learning shows significant prediction of cohort response using models trained on other cohorts combined.
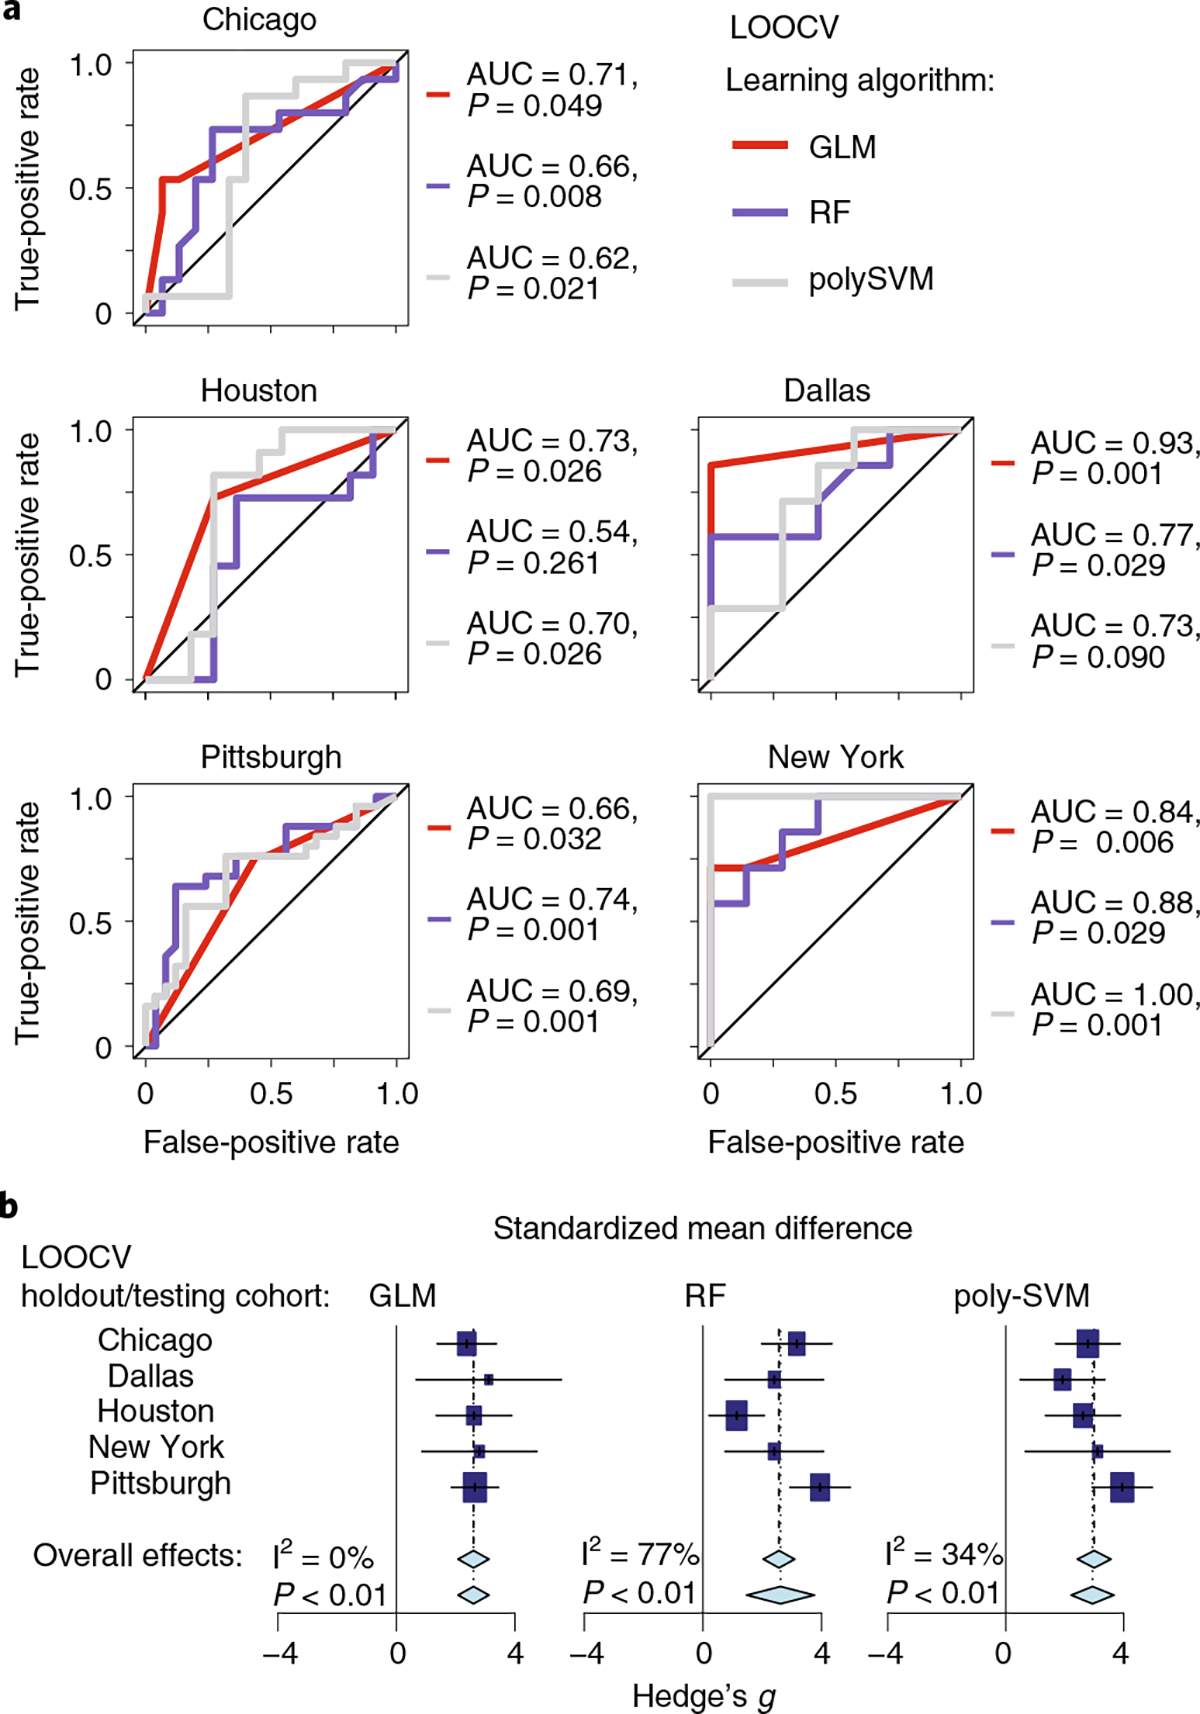
a, Receiver operating characteristic curves for models trained on the four cohorts and tested on the remaining cohort. Three machine learning (modified leave-one-out cross-validation (LOOCV)) methods were used: GLM, RF and poly-SVM. AUC and P values (P(accuracy) > no information rate) via the one-tailed binomial test) of the accuracy of models are given. b, Forest plots based on the results from a. Each machine learning method is represented by a separate forest plot, with cohorts shown on different lines. Hedge’s g (squares, standardized mean differences, size proportional to sample size) and associated 95% confidence intervals (bars) are shown along with the dashed vertical line of no effect. To control for unobserved heterogeneity, we separately evaluated Hedge’s g and P values using a random-effects model on metagenomic data and performed an I2 test for heterogeneity as shown.