
Extended Data Fig. 1 |. Kaplan-Meier plots of progression-free survival and overall survival in the Pittsburgh early sample cohort and progression-free survival after dichotomization for abundance of select bacterial species.
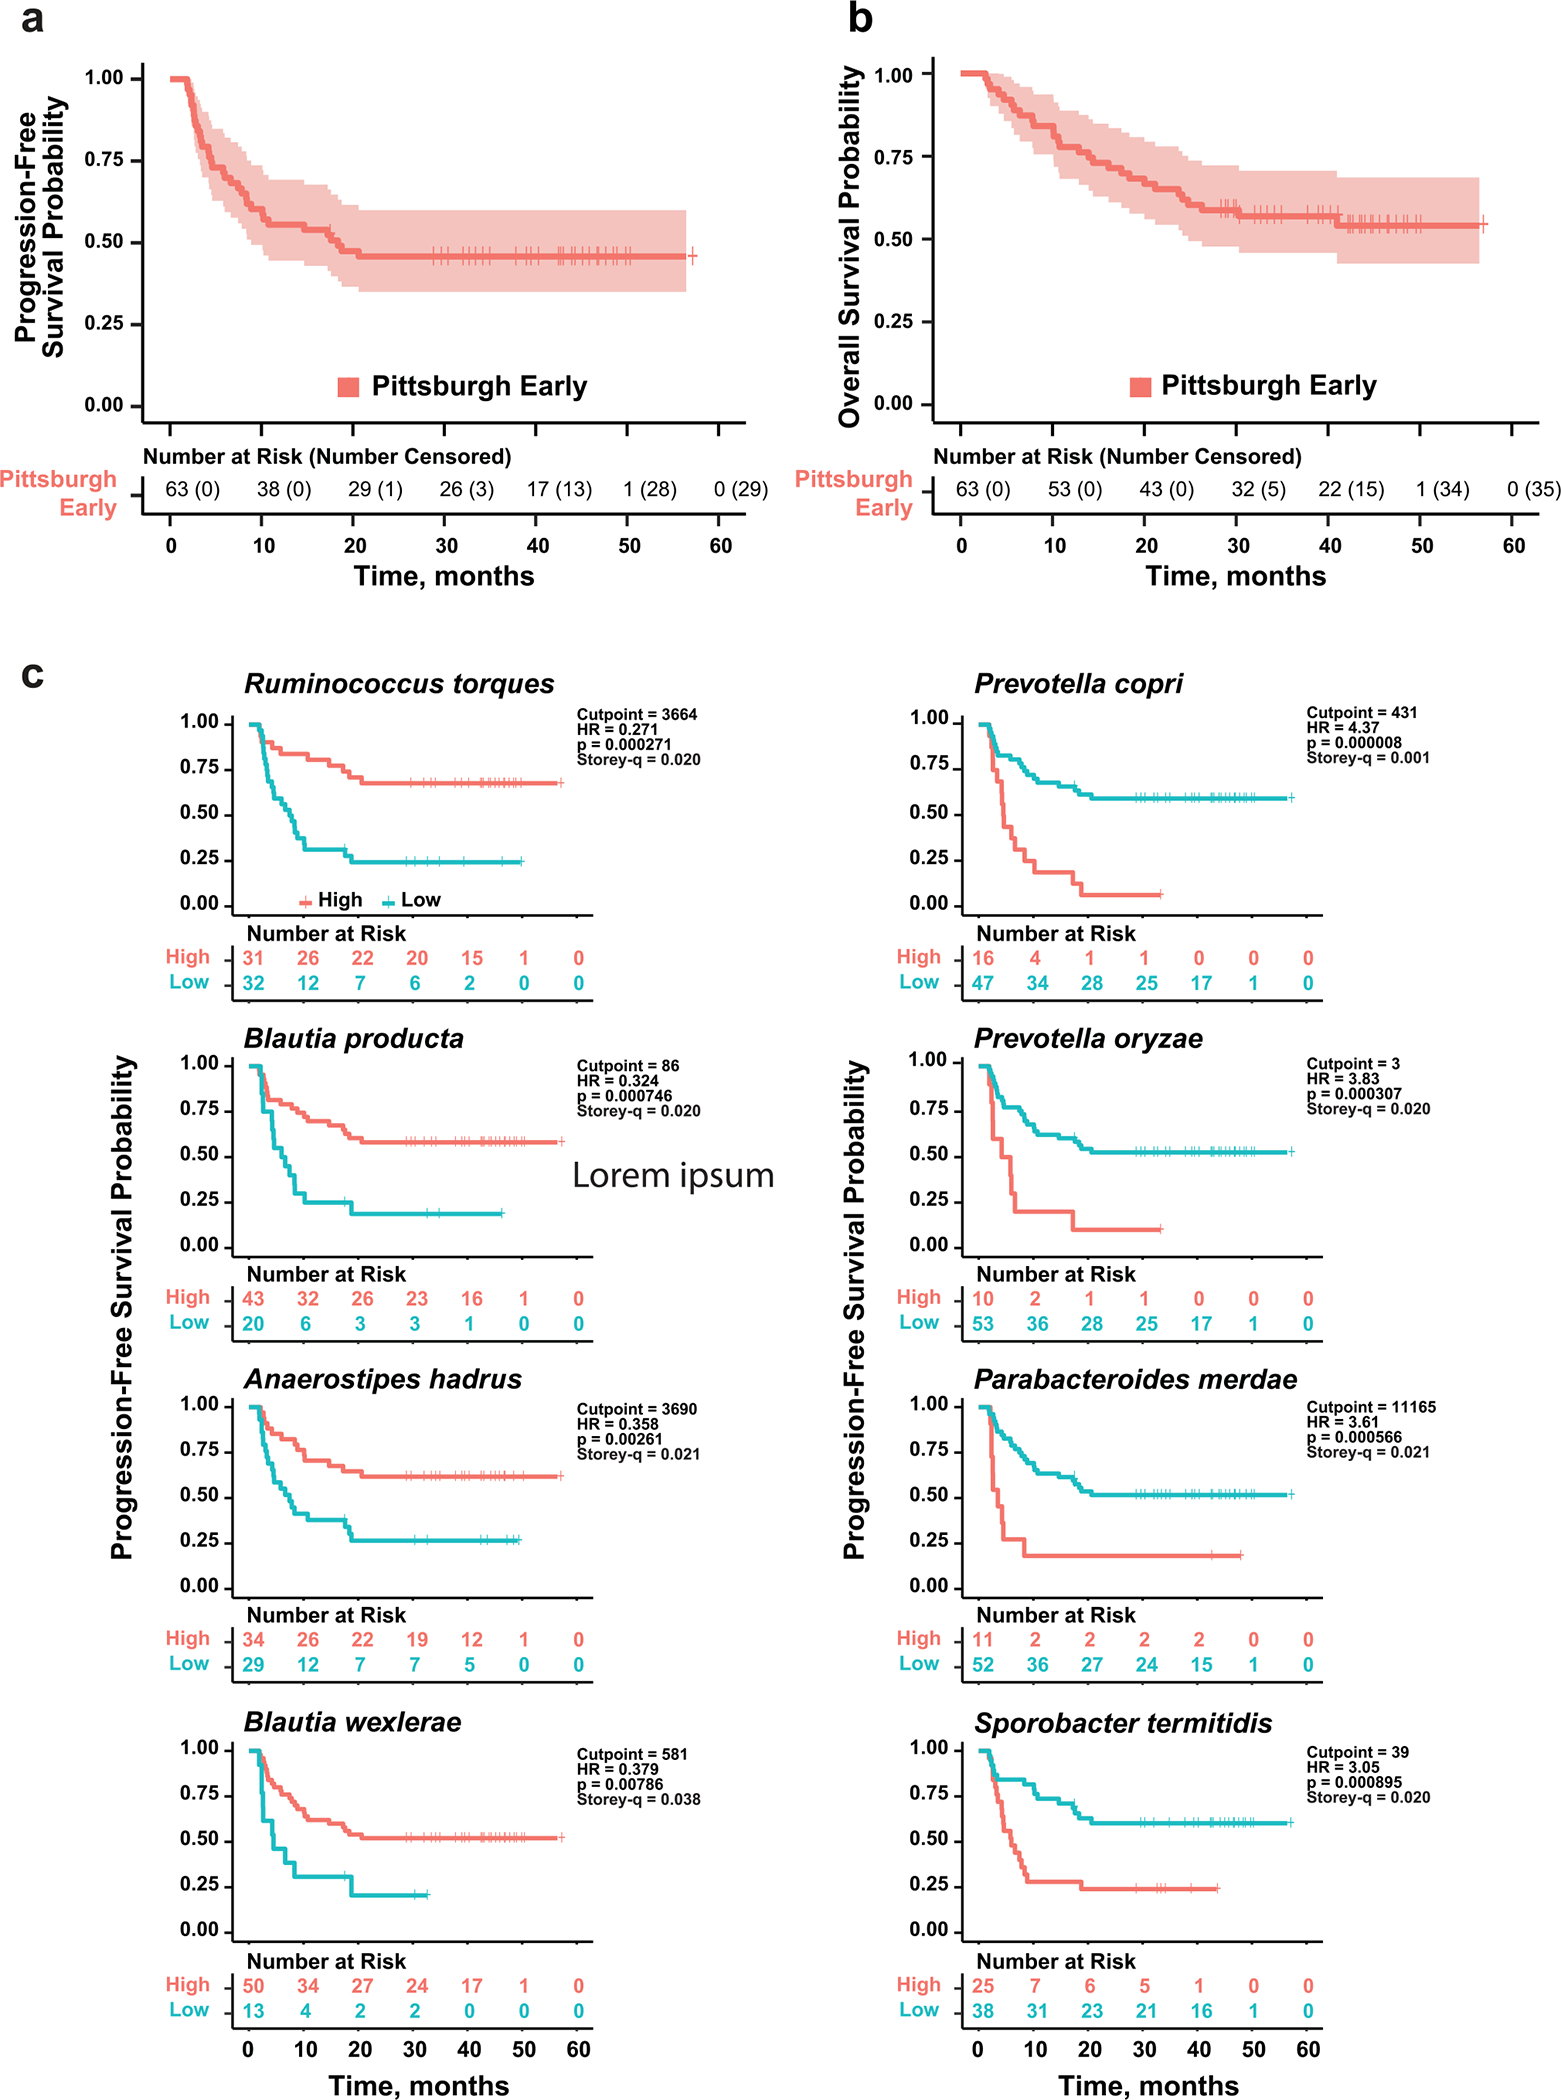
a and b. Kaplan-Meier plots of probability of progression-free survival (PFS) (a) and overall survival (OS) (b) of PD-1-treated Pittsburgh early cohort melanoma patients. Vertical ticks show censored data. Central line is median OS or PFS probability, shaded area shows 95% confidence interval. c. Optimal cutpoints of bacterial abundance determined using Evaluate Cutpoints. Different plots show the effect on PFS of abundance (high vs. low) of the top four most significantly increased (left) and decreased (right) individual bacterial species in non-progressors at 10 months, determined using Mann-Whitney U test (Fig. 1c). Number of people at risk in in either group (high vs. low abundance) is shown below each panel. Vertical ticks show censored data. Hazard Ratio (HR) and score (logrank) test two-tailed p-value from Cox proportional hazards regression analysis.