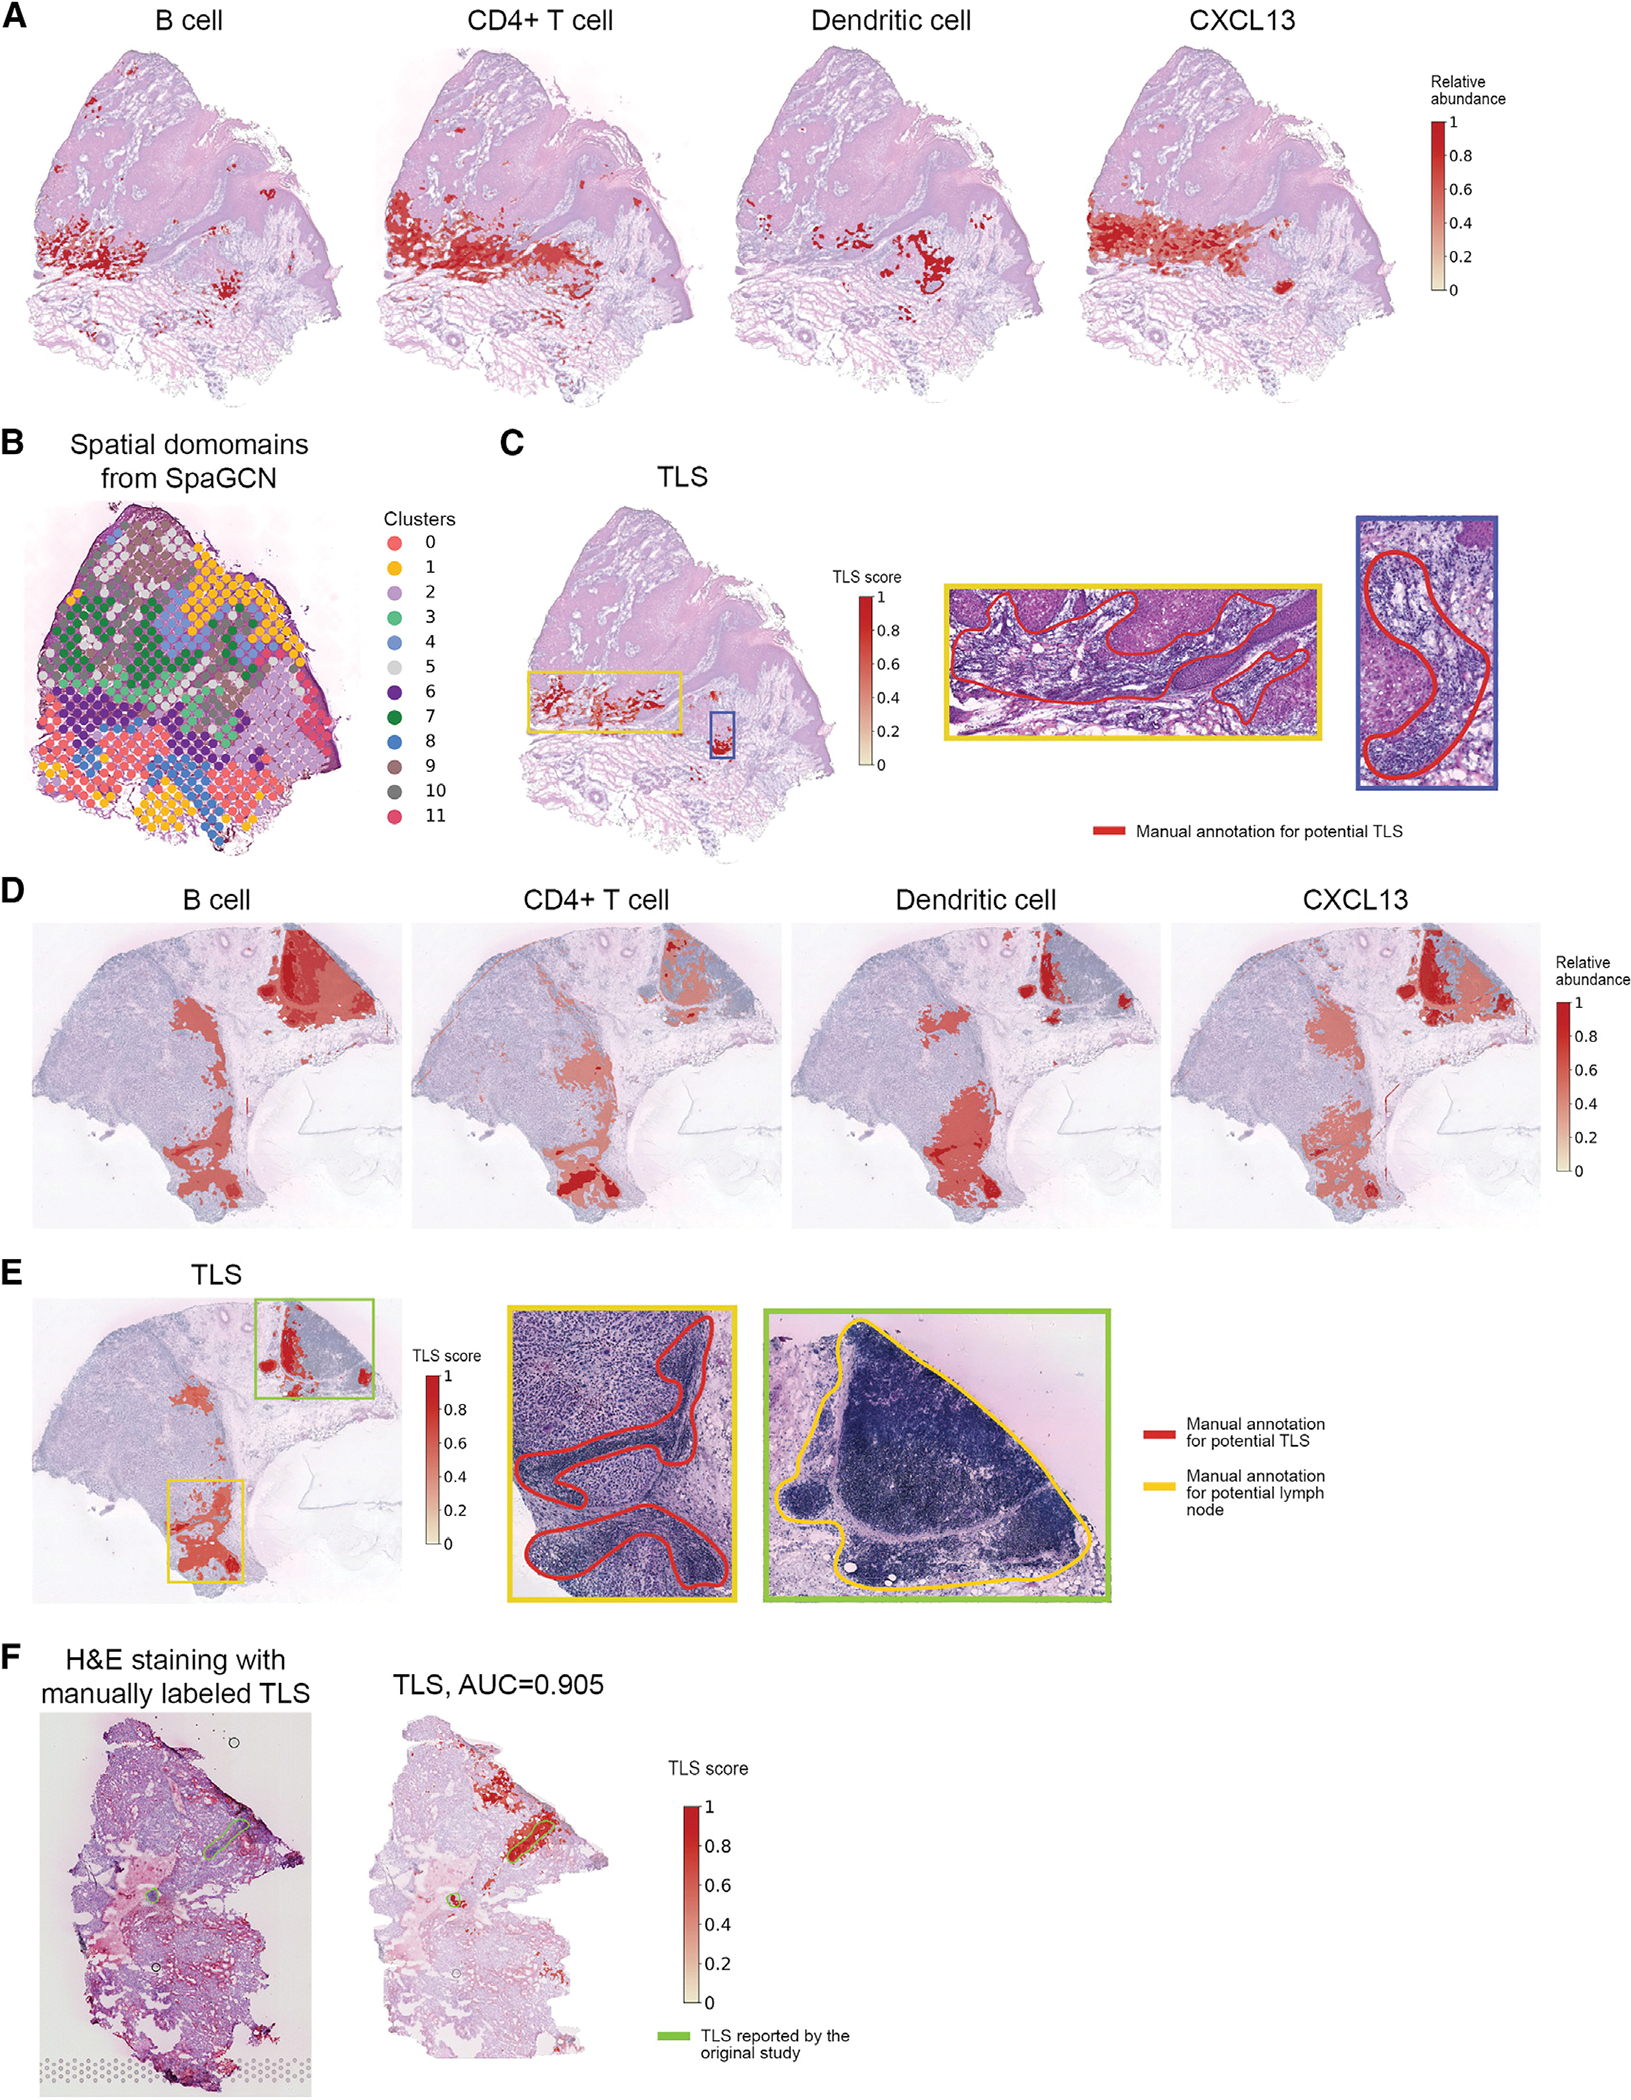
Figure 4. TESLA identifies lymphoid cell types and TLS with pixel-level resolution in the CSCC and melanoma samples.

(A) The distribution of B cells, CD4+ T cells, dendritic cells, and chemokine CXCL13 at pixel-level resolution characterized by TESLA in the CSCC tissue section.
(B) Clustering of spots of the CSCC tissue section using SpaGCN.
(C) TLS scores calculated by TESLA for the cutaneous CSCC tissue section. The blue box marks a highly possible TLS, whereas the green box marks a region with aggregated lymphocytes but not forming a TLS.
(D) The distribution of Bcells, CD4+ Tcells, dendritic cells, and chemokine CXCL 13 at pixel-level resolution characterized by TESLA in the melanoma tissue section. (E) TLS scores calculated by TESLA for the melanoma tissue section. The yellow and green boxes mark two potential TLSs, and the blue box marks a lymphoid node apart from the tumor region.
(F) H&E staining and TLS scores calculated by TESLA for the clear cell renal cell carcinoma (ccRCC) primary tumor data. The yellow line outlines the true TLS annotated by pathologists, which was further validated by triple immunofluorescence labeling (CD20/CD3/PD-1) on an immediately adjacent slide for frozen sample and CD3/CD20 labeling by immunohistochemistry for FFPE sample.
