
Figure 6. Architecture of the CNN for image segmentation in TESLA.
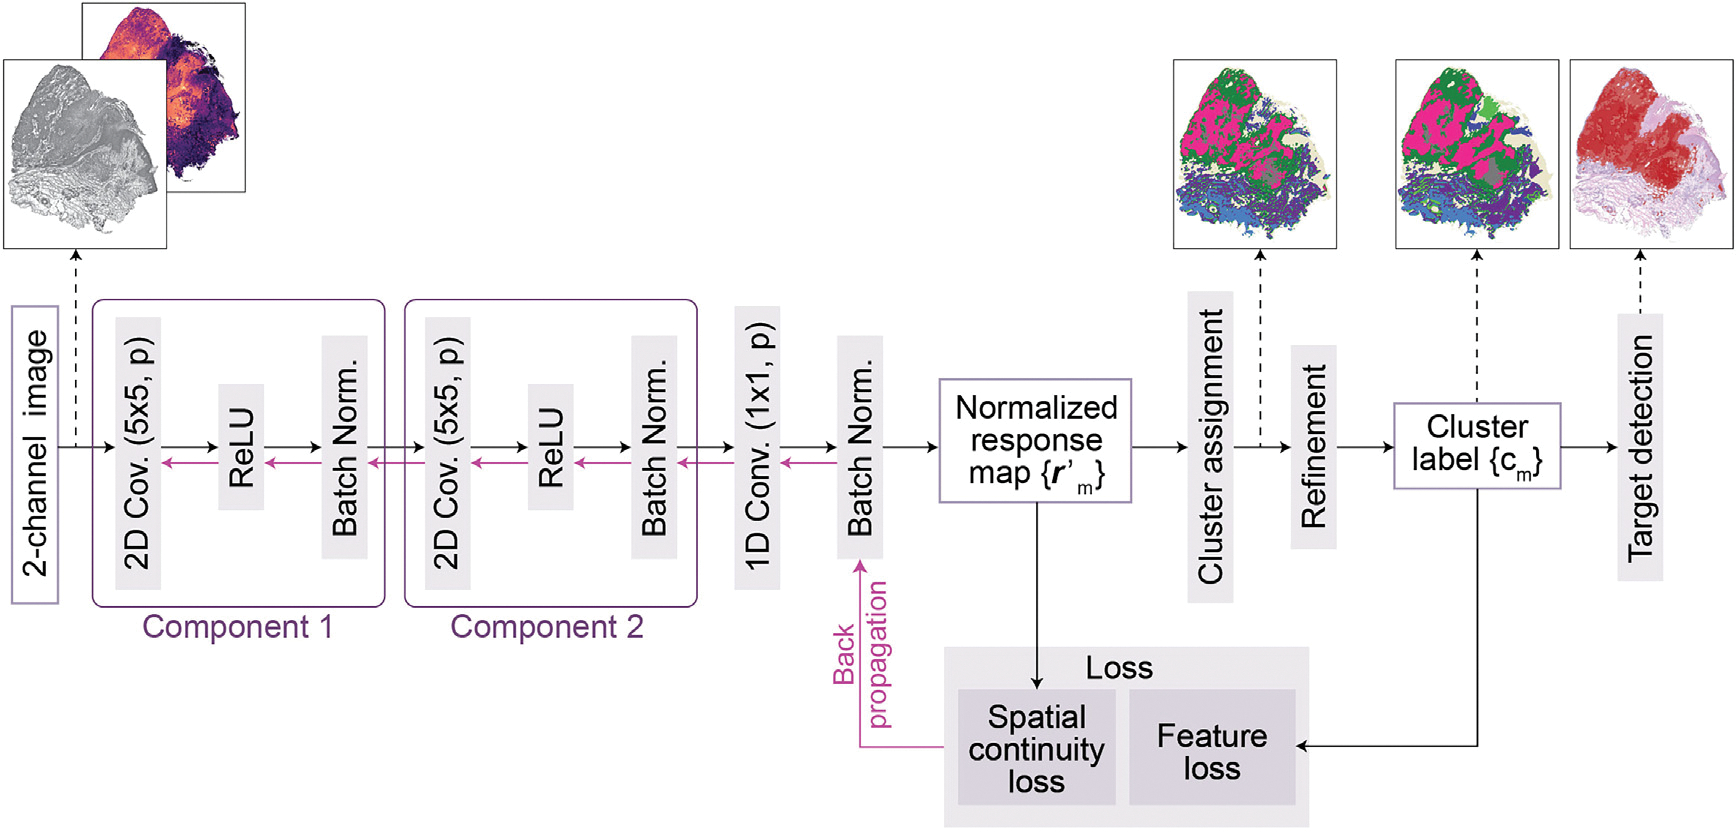
A 2-channel image is fed into the CNN to extract deep features through two convolutional components, each of which consists of a two-dimensional convolution , a ReLU activation function, and a batch normalization function. Subsequently, the response vectors of the features in -dimensional cluster space are calculated through a one-dimensional convolutional layer and normalized to across the axes of the cluster space using a batch normalization function. The normalized response map is used to calculate the spatial continuity loss. Further, raw cluster labels are determined by assigning the cluster to using an argmax function. Next, the raw cluster labels are refined to and used as pseudo labels to compute the gene expression loss. Finally, the spatial continuity loss, as well as the gene expression loss, are combined and backpropagated. After training, this CNN can segment input image into different clusters, and TESLA next identifies the clusters corresponding to the target region.