. 2023 May 16;14(22):5983–5991. doi: 10.1039/d3sc01453c

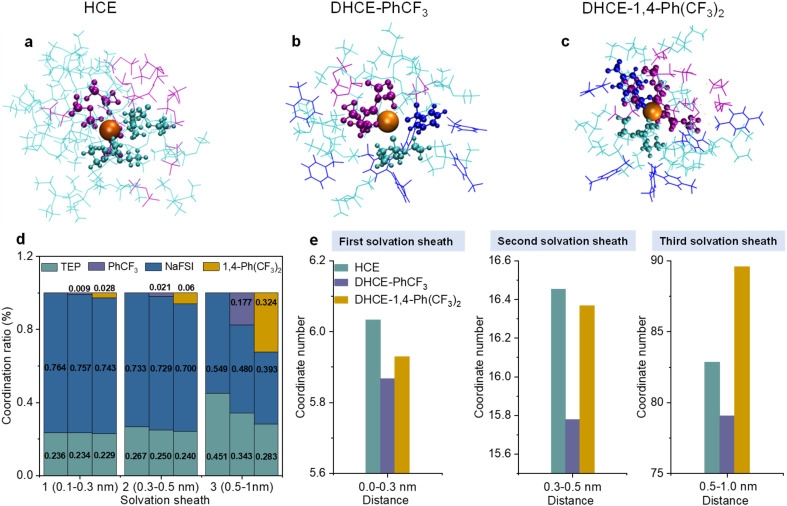
Fig. 1. Representative Na+ solvation structures of (a) HCE, (b) DHCE-PhCF3, and (c) DHCE-1,4-Ph(CF3)2 extracted from MD simulations. The TEP, FSI, Na+, and diluents (PhCF3 and 1,4-Ph(CF3)2) are shown in cyan, purple, orange, and blue, respectively. The TEP, FSI, and diluents (PhCF3 and 1,4-Ph(CF3)2) in the Na+ primary solvation sheath are depicted using a ball-and-stick model, while the wireframes stand for the second and third solvation sheaths. (d) The coordination ratios of different electrolytes at different solvation sheaths extracted from MD simulations. The bars in each solvation sheath (0–0.3 nm, 0.3–0.5 nm, 0.5–1 nm) represent HCE, DHCE-PhCF3, and DHCE-1,4-Ph(CF3)2 electrolytes from left to right, respectively. (e) The coordination numbers of Na+ in different electrolytes at different solvation sheaths extracted from MD simulations.

Fig. 1