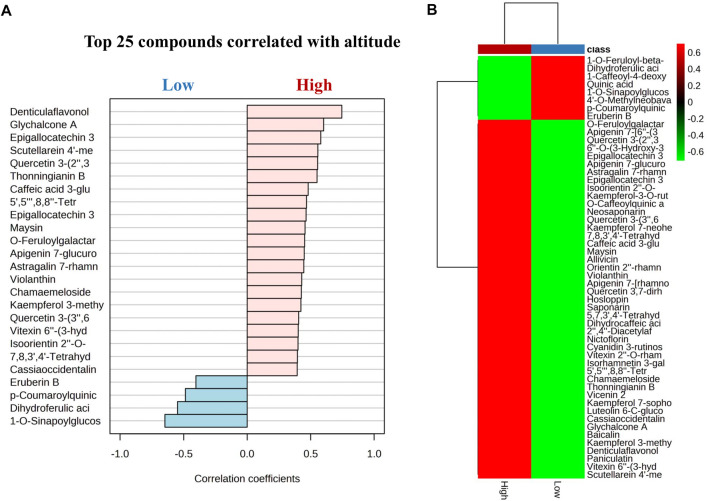
FIGURE 8.
(A) Pearson’s correlations using pattern search of the top 25 metabolites between low and high altitude. (B) Cluster heatmap based on correlation between flavonoids and acid cinnamic derivatives and the altitude variable. The analysis shows a positive (red) and negative (green) correlation with a p-value = 0.05 for all the metabolites.

