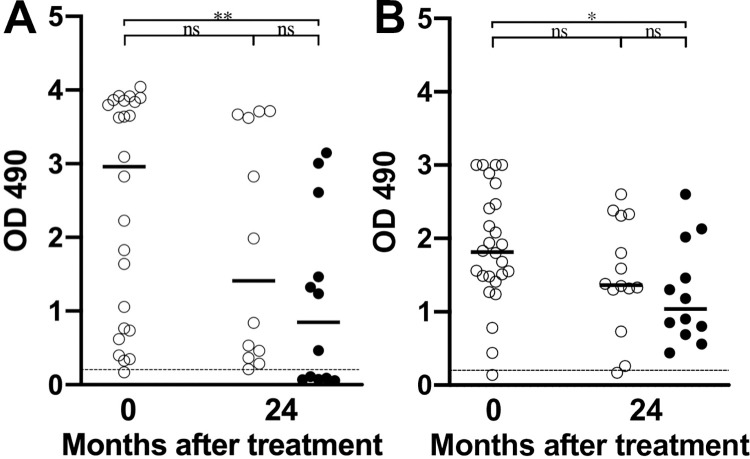
Fig 4. Changes in anti-filarial antibody levels following treatment in a Sri Lanka treatment trial.
Graphs show the OD490 for the (A) anti-rWb-Bhp-1 or (B) anti-rBm14 IgG4 ELISAs before and after treatment initiation, with data stratified by Mf status. Open circles indicate results for samples from people with persistent Mf, and closed circles indicate results from people who cleared Mf. Median values are shown with horizontal black bars. The dotted black line shows the threshold for antibody positivity (OD = 0.2). Significance as assessed by the Mann-Whitney U test is indicated (** is p<0.01, * is p<0.05, ns is not significant).

