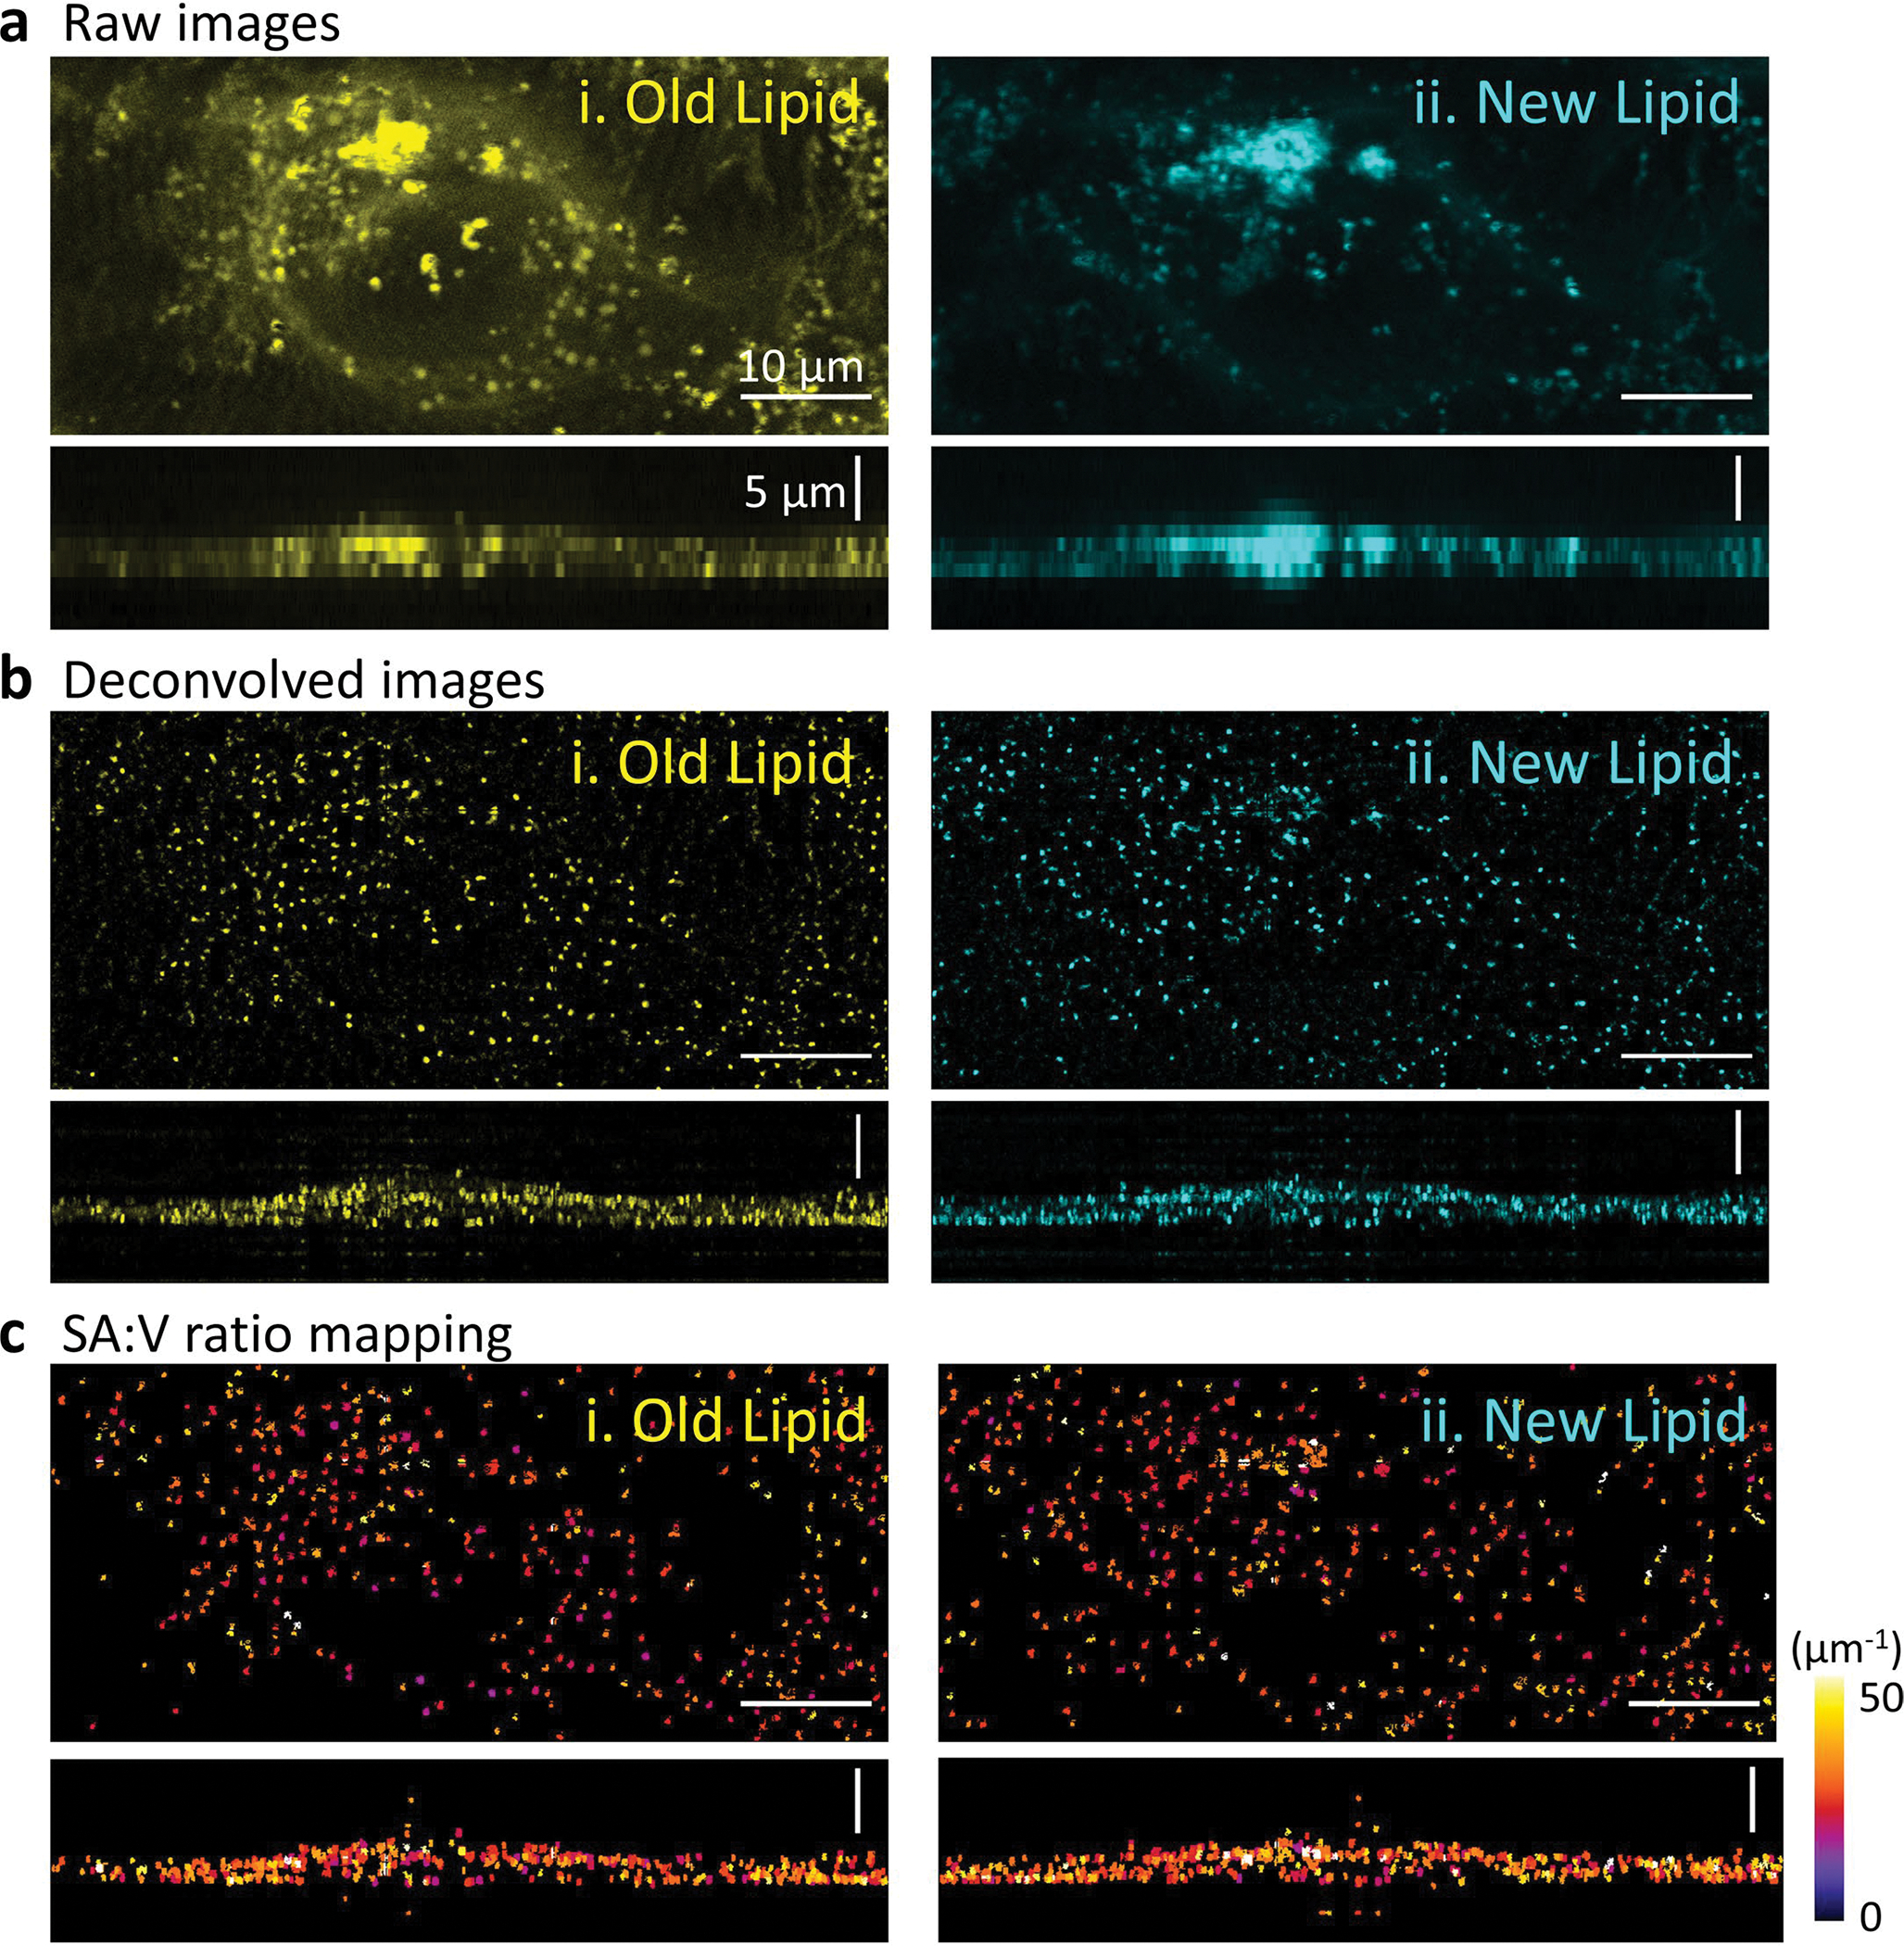
Extended Data Fig. 5 |. SRS images of a HeLa cell cultured in the standard medium.

a. Raw DO-SRS images of the HeLa cell. b. Deconvolution results of the images. The images show the shape and distribution of the lipid droplets in sub-micron scale. c. After measuring the surface area and volume of individual lipid droplets, the surface area to volume ratio of individual LDs was mapped.
