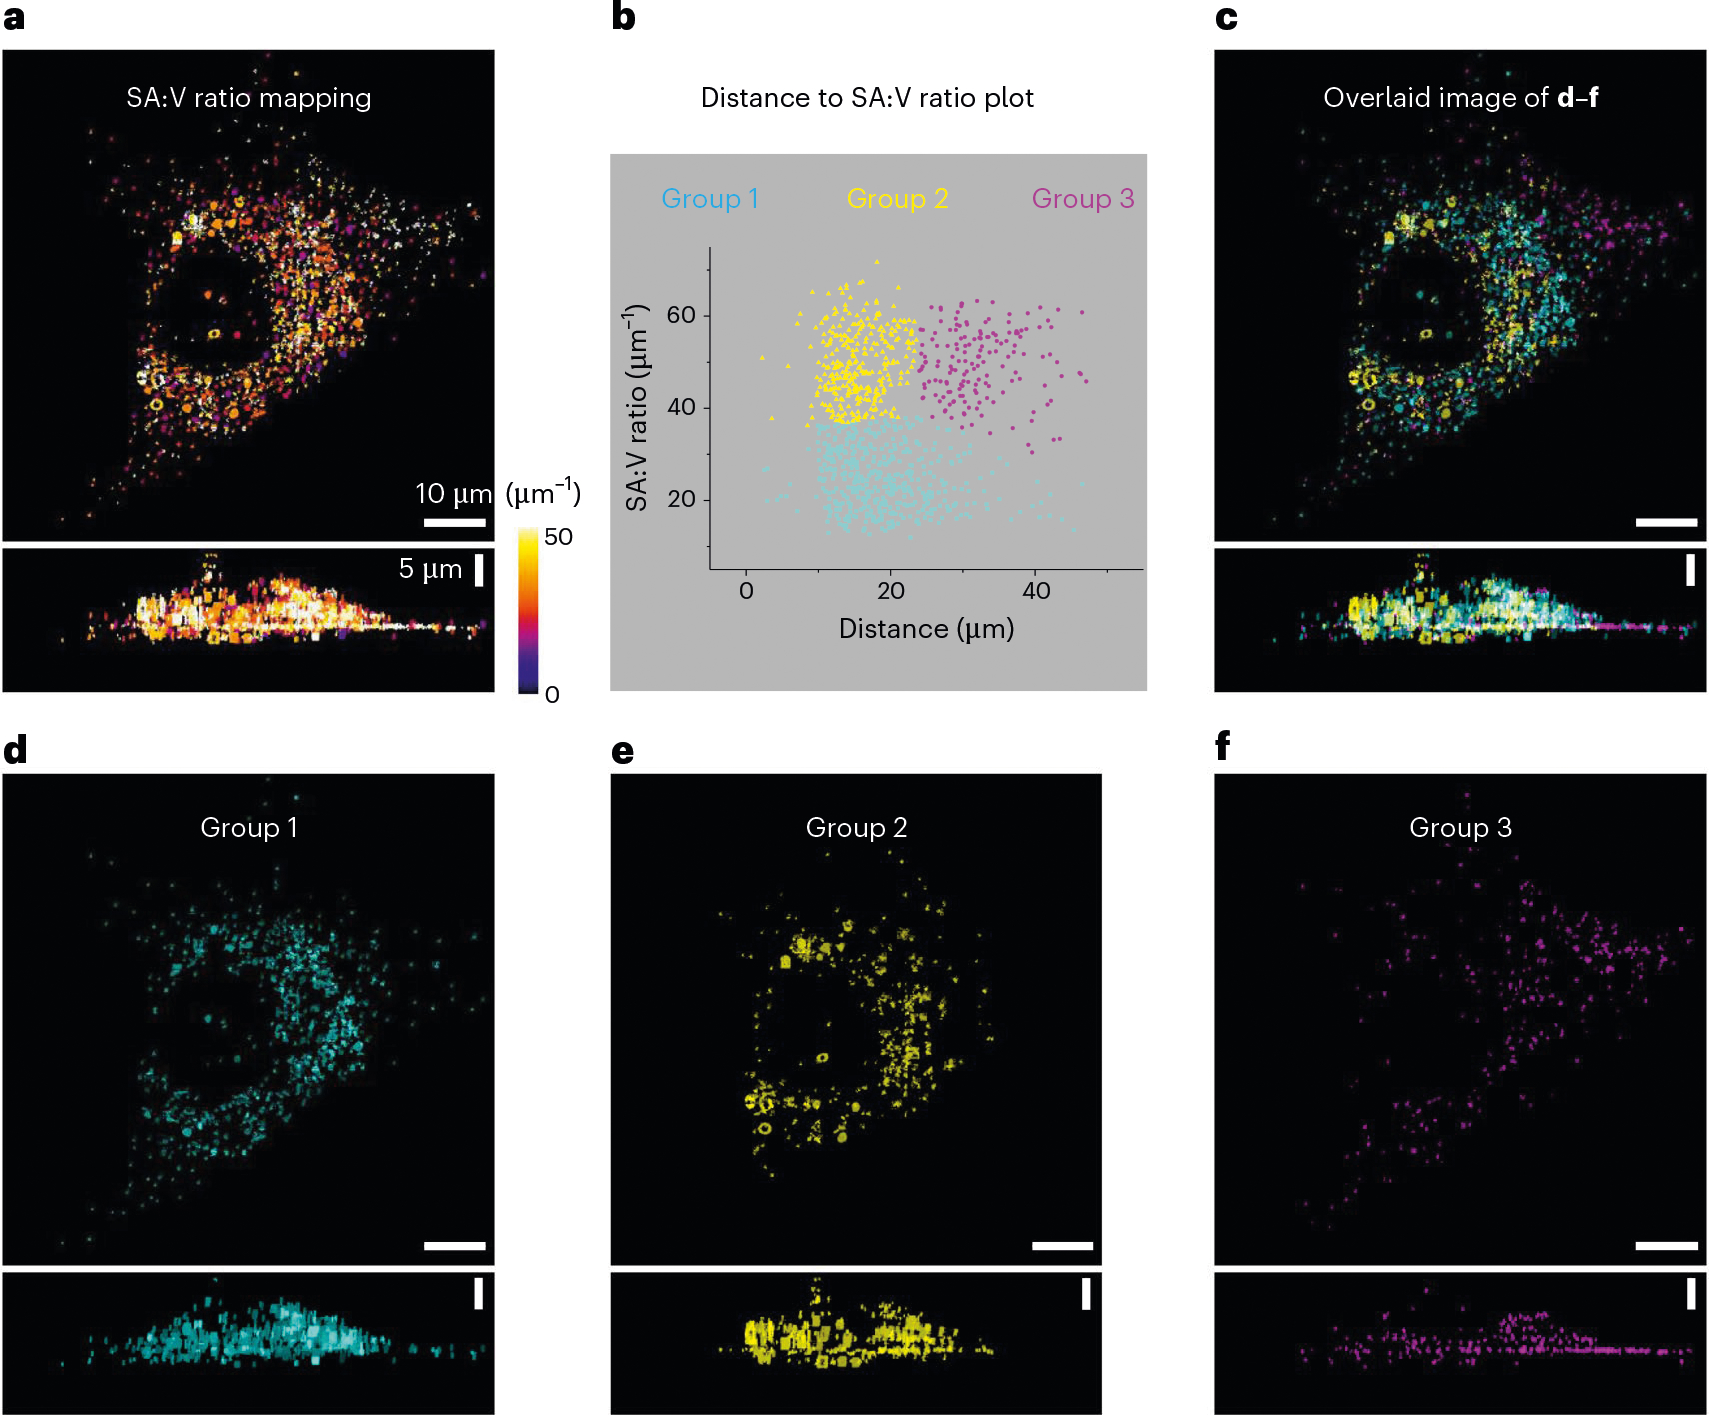
Fig. 3 |. SA:V ratio analysis.

a, The SA:V ratio of LDs in the breast cancer cell image in Fig. 2c was mapped. b, k-mean clustering shows that the three groups of LDs have different SA:V ratios. c, The LD images in different groups (d–f) were overlaid. d, LDs in group 1 are widely distributed in the cell, with a low SA:V ratio. e, LDs in group 2 have a high SA:V ratio, and they are distributed closely around the nucleus. f, LDs in group 3 also have a high SA:V ratio, and they were distributed far away from the nucleus. n = 3 cells per experiment, total of six experiments.
