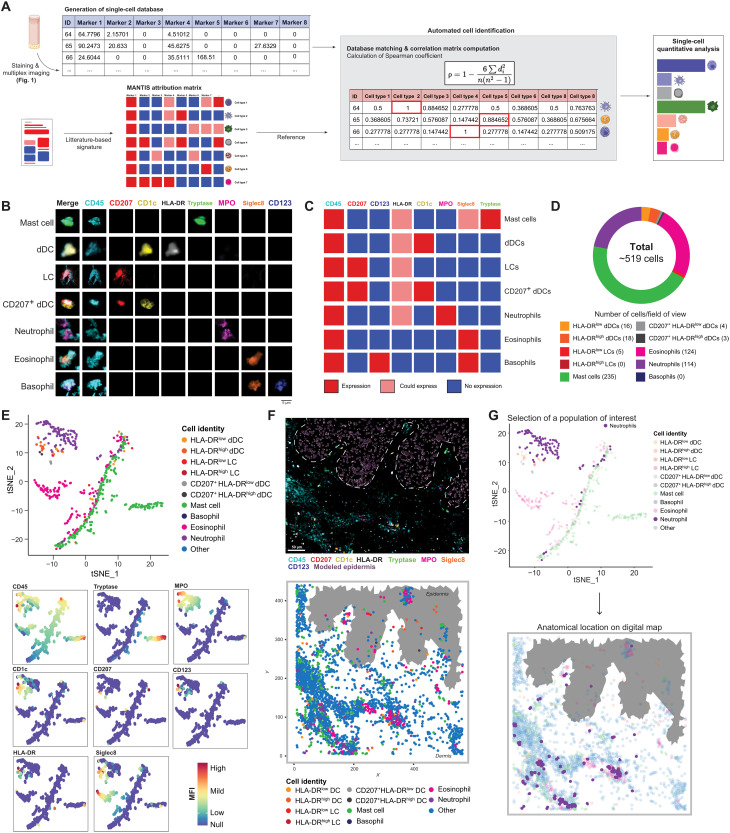
Fig. 2. MANTIS algorithm allows automated cell type attribution and interactive exploration of skin myeloid immune topology.
(A) Automated tissue annotation. A reference attribution matrix defining the literature-based theoretical signature of a particular cell type was constructed and designated as MANTIS attribution matrix. A correlation matrix calculating Spearman coefficient between the single-cell database and MANTIS attribution matrix was computed. Each segmented cell was annotated to the cell type having the highest correlation coefficient, and cell type proportions were extracted. (B) Single-cell staining of all used biomarkers in identified myeloid cells. Scale bar, 5 μm. (C) MANTIS-simplified attribution matrix for myeloid panel. (D) Tissue annotation and cell proportion of pathological (SLE) skin. (E) Representative t-SNE plot of myeloid cell populations (top) and MFI levels of used markers (colored intensity scale) (bottom). (F) Representative 3D confocal multiplex image (top) and associated digital map (bottom) of predesigned MANTIS myeloid panel of pathological (SLE) skin. Scale bar, 50 μm. (G) Interactive reverse-gating. A population of interest (neutrophils) was selected on the t-SNE plot. Recomputation of the corresponding digital map enabled the visualization of the anatomical distribution of this particular population in the skin biopsy.

