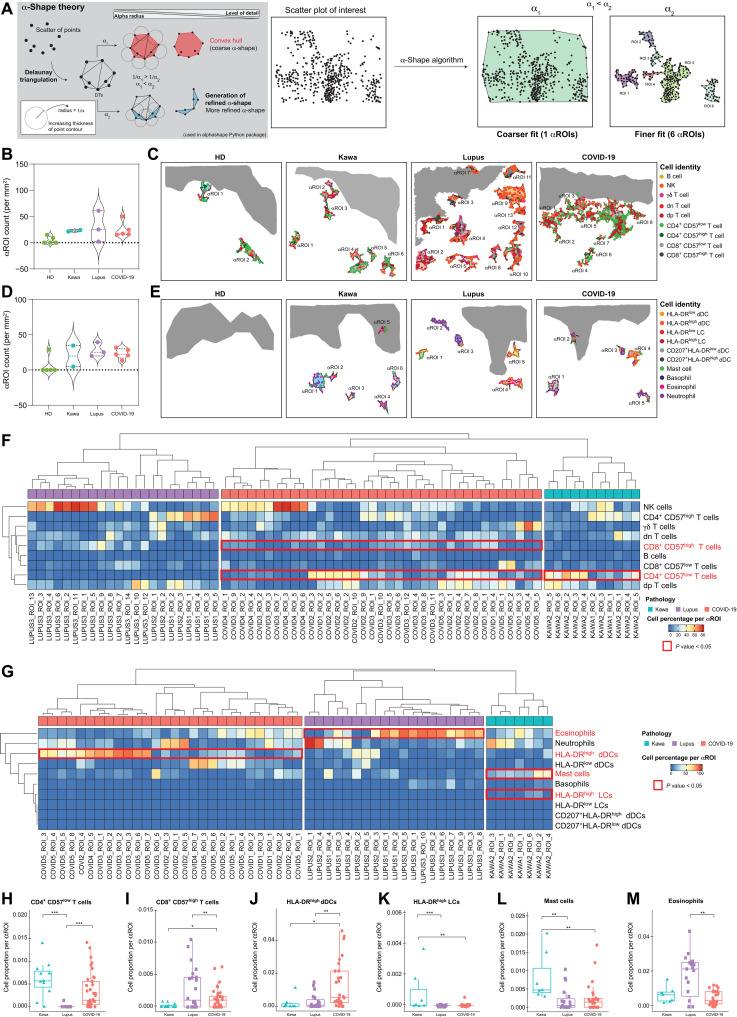
Fig. 4. Automatic detection of αROI enables exploration of inflammatory cluster topography in healthy and diseased skin.
(A) α-Shape algorithm. Delaunay triangulation of a given set of points formed a bounding polygon that contains all the points of the set. The α parameter was defined by the value α, and a circle with 1/α radius was drawn around each point of the dataset. The line between two circles’ meeting points formed a side of the bounding polygon, i.e., the α-shape. α value defines the detail level of the α-shape and allows modeling of voluminous structures (1/α1) or smaller structures (1/α2) having 1/α1 > 1/α2. (B and C) Violin plot (B) and representative digital maps (C) of lymphoid αROI density in healthy and pathological skin. (D and E) Violin plot (D) and representative digital maps (E) of myeloid αROI density in healthy and diseased skin. (F and G) Representative heatmaps of cell proportions in lymphoid (F) and myeloid (G) αROIs in pathological skin. A hierarchical clustering was applied on rows and on each pathology’s column. (H to M) Mean proportion of CD4+ CD57low T cells (H), CD8+ CD57high T cells (I), HLA-DRhigh dDCs (J), HLA-DRhigh LCs (K), mast cells (L), and eosinophils (M) per αROI in diseased skin. Means ± SEM; *P < 0.05, **P < 0.01, and ***P < 0.001, one-way analysis of variance (ANOVA) (H to M).

