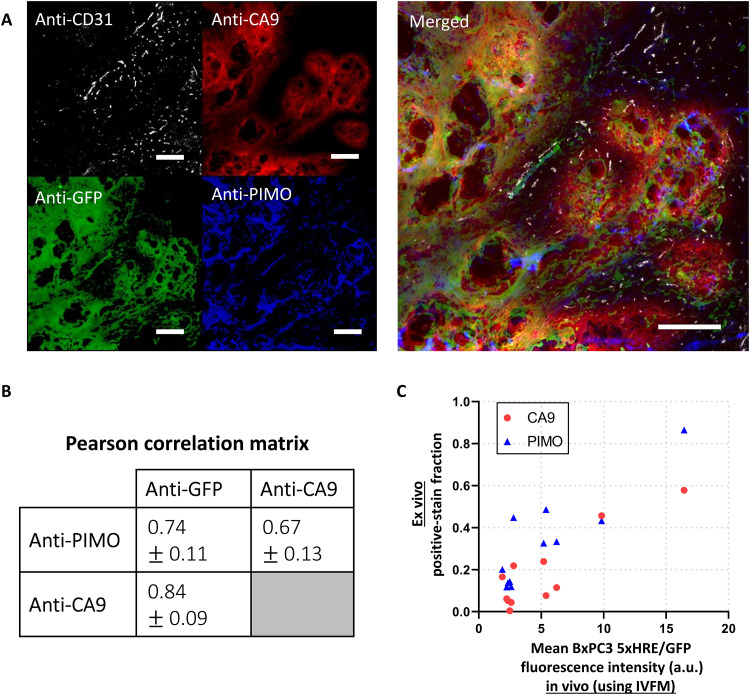
Fig. 6. In vivo expression of 5xHRE/GFP in BxPC3 tumor cells correlates with conventional biomarkers of tumor hypoxia.
(A) Representative immunofluorescence (IF) images from serial BxPC3 pancreatic tumor tissue sections (5 μm thick). Tumors were excised immediately after the final in vivo imaging time point. Sections were stained with anti-CD31, anti-CA9, anti-GFP, and anti-PIMO. Scale bars, 200 μm. (B) A correlation matrix shows the mean Pearson correlation coefficients between each IF stain, across 10 tumor samples (± SD). (C) A scatter plot shows the relationship between the hypoxic biomarker (CA9 and PIMO) IF positive-stain fraction in ex vivo tumor tissue sections versus the mean GFP fluorescence intensity of the same tumors in vivo, using IVFM. r = 0.88 (P = 0.0003) and 0.89 (P = 0.0003), respectively. n = 11 tumors.

