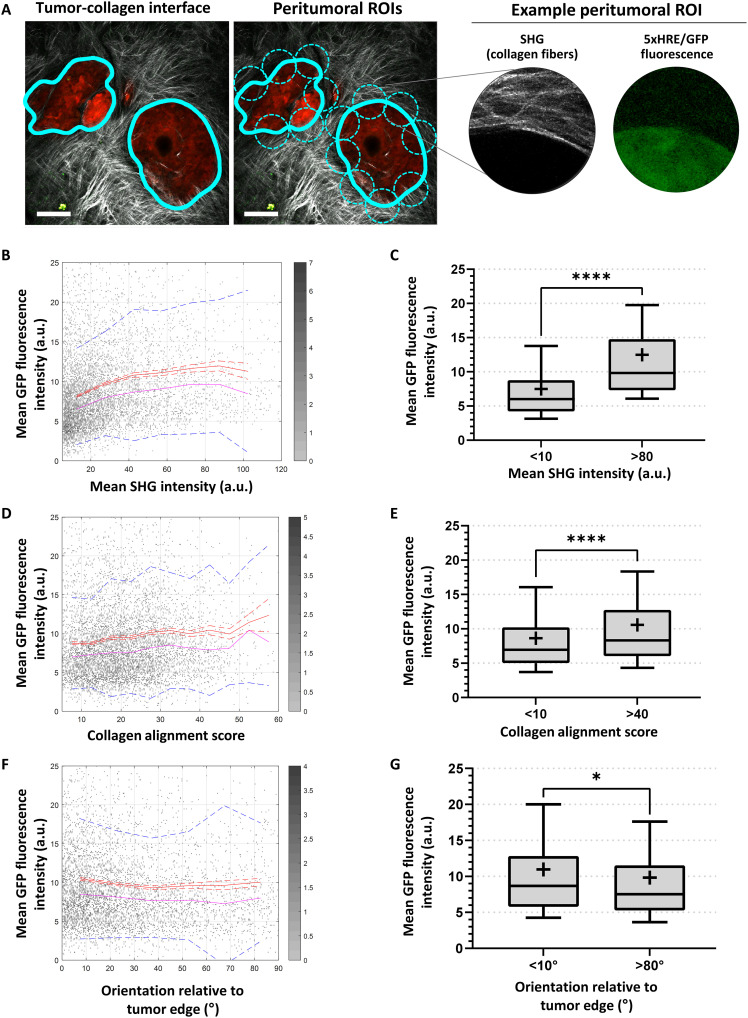
Fig. 7. Peritumoral collagen production is associated with BxPC3 5xHRE/GFP expression.
(A) Image analysis framework used to analyze collagen and BxPC3 5xHRE/GFP expression along the tumor-collagen interface (thick cyan line). Dashed cyan circles indicate each peritumoral ROI, with a diameter of 100 μm, spaced 100 μm apart. Scale bars, 100 μm. (B, D, and F) Scatter plots show the mean GFP fluorescence intensity versus mean SHG intensity (r = 0.21, P < 0.0001), alignment score (r = 0.09, P < 0.0001), and orientation relative to tumor edge (r = −0.05, P < 0.0001), respectively. n = 6846. The red lines indicate mean values, red dashed lines are SEM, pink lines are median values, and blue dotted lines show SD. (C, E, and G) Box plots show the mean GFP fluorescence intensity of BxPC3 cells for different ranges of SHG intensity, alignment score, and collagen orientation relative to tumor edge, respectively. Mean values are indicated by the “+” symbol on each boxplot. Whiskers show 10th to 90th percentile of mean GFP fluorescence intensity in peritumoral ROIs. *P < 0.05 and ****P < 0.0001.

