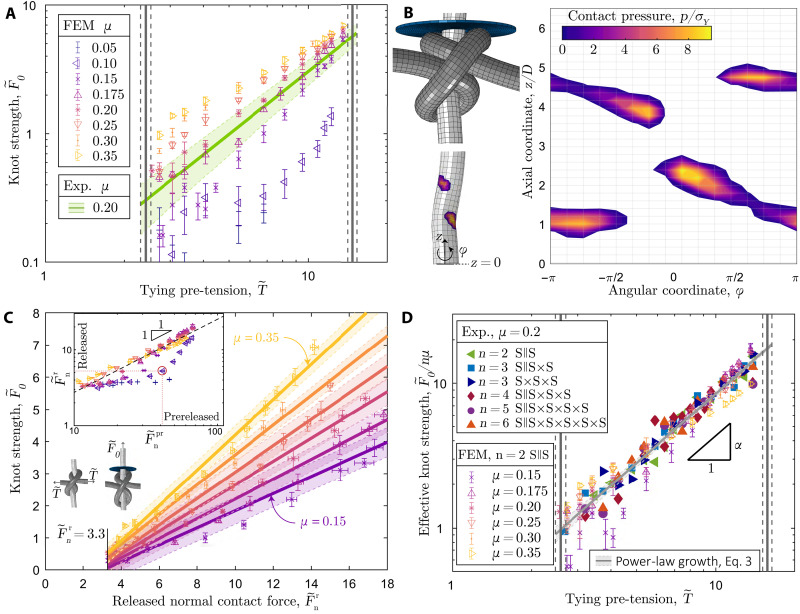
Fig. 4. Analysis of surface tractions and master curve for knot strength.
(A) FEM-computed knot strength, , versus tying pre-tension, , for the S || S (n = 2) configuration, over a range of friction coefficients, μ ∈ [0.05 − 0.35]. The green line corresponds to the experimental fit of the data in Fig. 3B to Eq. 1; the shaded region represents the 65% confidence interval of the fit. The experimental value of the friction coefficient is μ = 0.2 (fig. S4). (B) Three-dimensional visualization of the S || S knot system () simulated using FEM (top). Contact pressure, p/σY, visualized on the pulled 3D rod (bottom) and mapped in 2D along the axial coordinate, z/D, and the angular coordinate, ϕ(right). (C) Knot strength, , versus released integrated normal contact force, , for friction coefficients in the range, μ ∈ [0.15 − 0.35]; see legend in (A). Linear fit of the data (lines) and 65% confidence interval (shaded regions). Inset: Released normal contact force, versus the prereleased normal contact force, , for all the simulated values of μ; see legend in (A). Spring back (dilation) of the knots is observed for the datasets with μ = 0.05, 0.10, an example of which is shown in the adjacent FEM configuration corresponding to the red-circled data point (μ = 0.10, ). (D) Effective knot strength, , versus , combining all the experimental and numerical results obtained in this study.

