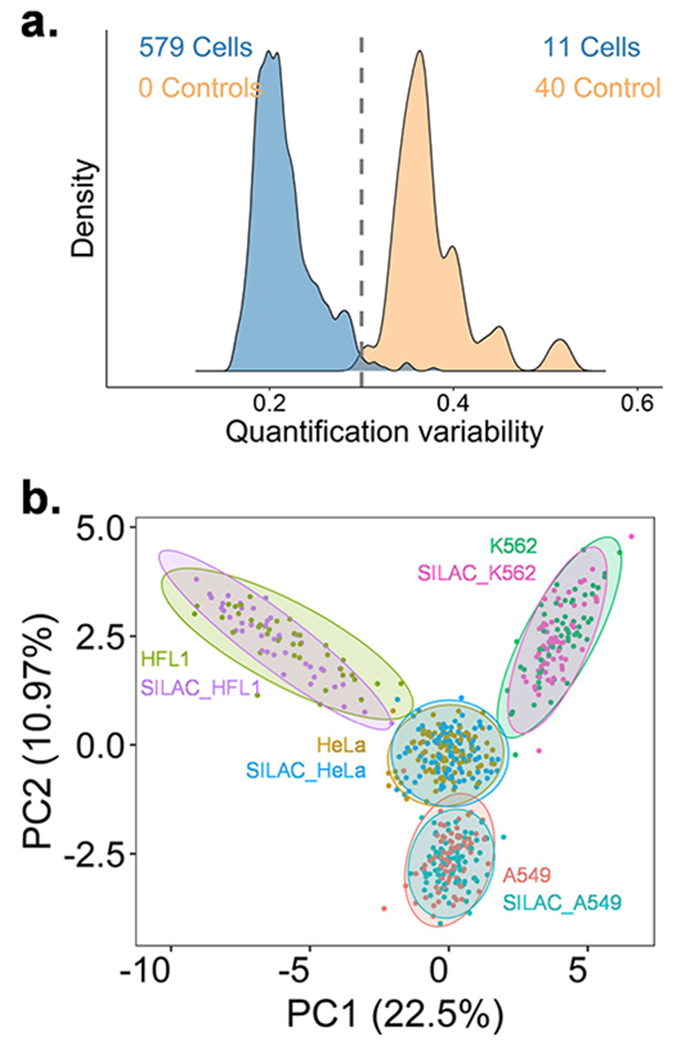
Figure 3.

Comparison of single HeLa, A549, K562, and HFL1 cells using hyperSCP with 10 ng carrier proteome and 60-min gradient. (a) Median protein CVs from single-cell channels and negative control channels. The cutoff was set to 0.3 to remove outliers. (b) PCA plot of four cell lines. The shared proteins that have 60% valid values and were quantifiable from all cell lines were used for analysis.
