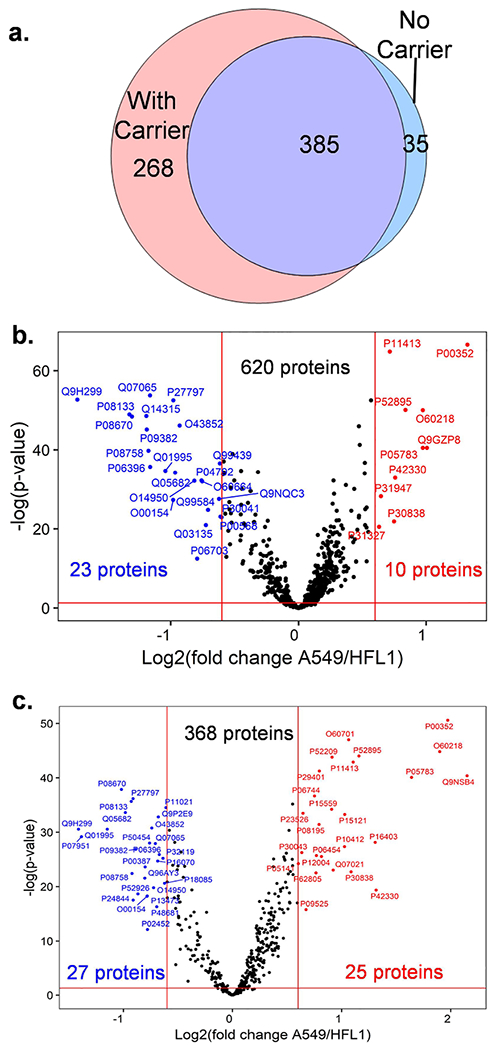
Figure 4.

Differential protein abundances between HFL1 and A549 lung cells. (a) Venn diagram shows the quantifiable proteins found from both HFL1 and A549 cells while using a 10-ng carrier channel or no carrier channel. (b,c) Volcano plot indicates the proteins with fold change >1.5 and Benjamini–Hochberg adjusted p-value <0.05 with a 10-ng carrier channel (b) and without carrier (c).
