
Fig. 2. Waterfall plots showing changes in risk factors & metabolic markers from baseline to evaluation for each patient (n = 35).
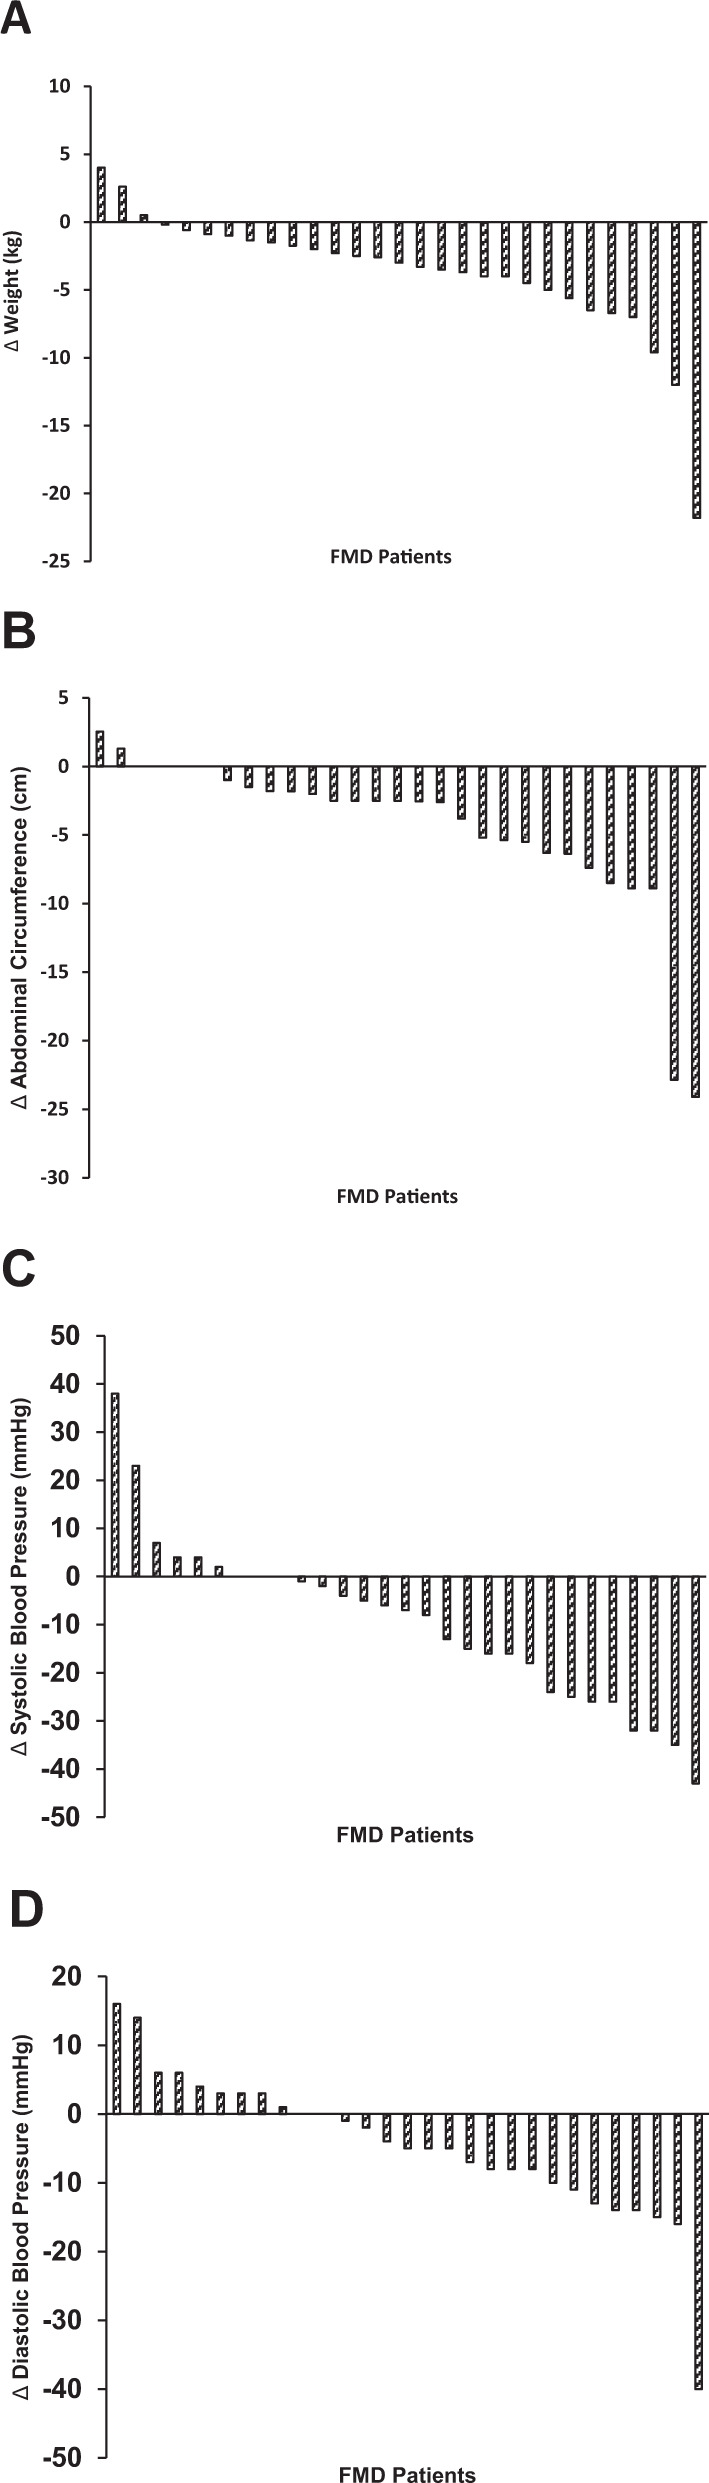
Results of metabolic syndrome risk factors and metabolic markers in all subjects who completed the FMD regime. A Body weight, B Abdominal circumference, C Systolic Blood Pressure, D Diastolic Blood Pressure. All data represents average difference between baseline data and evaluation (i.e., weight at evaluation minus weight at baseline) of individual FMD participants. For some of the enrolled participants our team were unable to collect laboratory samples from all subjects. We therefore excluded subjects with incomplete measurements from a particular marker group as seen in Table 2. ∆, difference in datapoint from evaluation to baseline. A–D Change analysis of metabolic variables from baseline to evaluation.