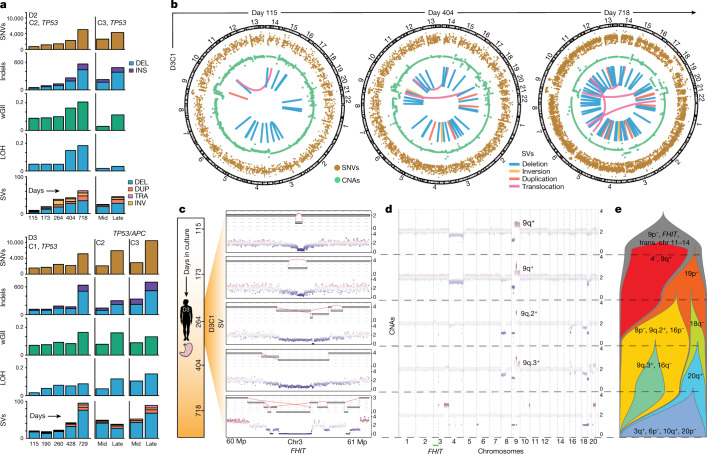
Fig. 2. TP53 deficiency elicits subclonal copy number evolution, SVs and clonal interference.
a, Burden of different classes of somatic genomic alterations in TP53–/– and TP53–/–, APC–/– HGOs (relative to WT over time), as assessed by longitudinal WGS of individual cultures at the specified time points (mid, day 296; late, days 743–756). b, Circos plots for D3C1 illustrating increasing genomic instability and complexity over time. Classes of alterations shown include SNVs (adjusted variant allele frequencies), CNAs (log(R)) and SV consensus calls (Methods). c, Evolution of rigma-like SVs at the FHIT fragile site on chr3p. Zoomed-in view of a 1 Mb region in the FHIT locus. Top, reconstructed SVs; bottom, corresponding CNAs. d, Longitudinal CNA profiles for D3C1. e, Fishplot schematic for D3C1 illustrating subclonal CNA evolution, clonal interference and extinction. Subclone frequencies (x axis) were determined based on CNAs visualized in d (Methods). DEL, deletion; DUP, duplication; INV, inversion; TRA, translocation. Image of stomach in c is from Servier Medical Art, CC BY 3.0.

