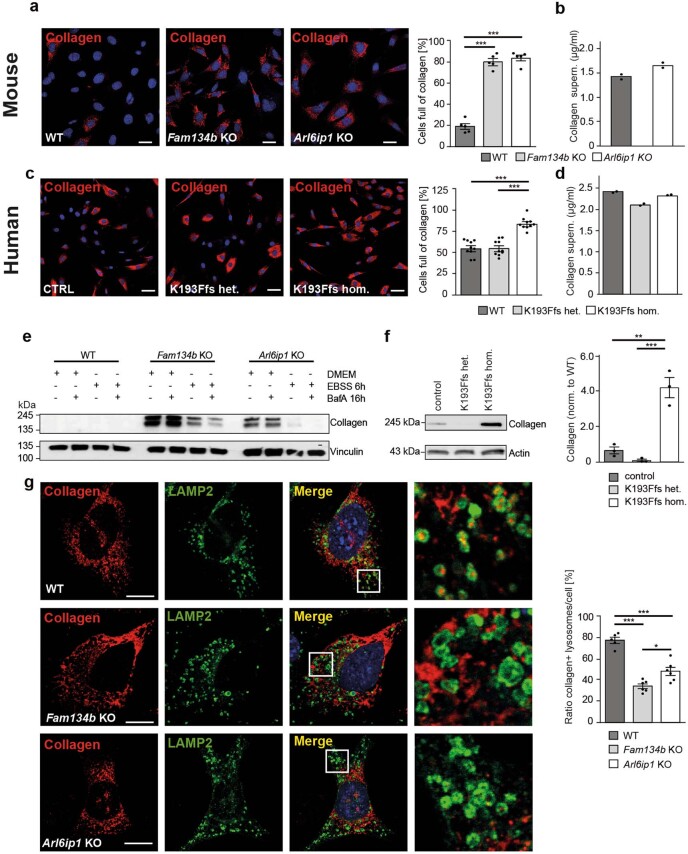
Extended Data Fig. 9. Intracellular accumulation of collagen in the absence of ARL6IP1.
a) The ratio of cells strongly labelling for collagen is increased in both Fam134b and Arl6ip1 KO MEFs (1 exp. with n = 86 WT cells, n = 121 FAM134B KO MEF cells, n = 69 ARL6IP1 KO MEFs analysed; one-way ANOVA with Bonferroni post-hoc analysis, F-value = 171.7, p = 0.0001: WT versus Fam134b KO p = 0.0001, WT versus Arl6ip1 KO p = 0.0001). Scale bar: 50 µm. b) Comparable collagen levels in the supernatants of Fam134b and Arl6ip1 KO MEFs exclude a defect of collagen secretion (1 exp. with n = 2 samples). c) The ratio of cells strongly labelling for collagen is increased in fibroblasts of the patient homozygous for the K193Ffs variant (n = 3 experiments with 344 (control), 310 (K193Ffs het.), 399 (K193Ffs hom.) cells analysed; one-way ANOVA with Bonferroni post-hoc analysis, F = 40.02, p = 0.0001: WT versus K193Ffs hom. p = 0.0001, K193Ffs het. versus K193Ffs hom. p = 0.0001). d) Comparable collagen levels in the supernatants of fibroblasts of a healthy control, the heterozygous father and the affected patient exclude a defect of collagen secretion (1 exp. with n = 2 samples). e) Western blot analysis of WT, Fam134b KO and Arl6ip1 KO MEFs at steady state and EBSS starvation with or without Bafilomycin A1 (BafA). The accumulation of collagen is not enhanced upon Bafilomycin A1 treatment. This suggests that the removal of misfolded collagen by ER-phagy is abolished in Arl6ip1 KO MEFs. Vinculin served as loading control (1 exp.). f) Accumulation of collagen in patient fibroblasts. Actin served as loading control (3 experiments; one-way ANOVA with Bonferroni post-hoc analysis, F-value = 40.8, p = 0.0003: WT versus K193Ffs hom. p = 0.0011; K193Ffs het. versus K193Ffs hom. p = 0.0005). g) MEFs devoid of Fam134b or Arl6ip1 cannot deliver collagen to lysosomes. Quantification of collagen-positive lysosomes per cell in cells loaded with collagen (1 exp., 6 cells analysed with 564 (WT), 474 (Fam134b KO), 785 (Arl6ip1 KO) puncta counted; one-way ANOVA with Bonferroni post-hoc analysis, F-value 47.59, p = 0.0001: WT versus Fam134b KO p = 0.0001, WT versus Arl6ip1 KO p = 0.0001, Fam134b KO versus Arl6ip1 KO p = 0.0165). Scale bars: 20 µm. Quantitative data are shown as mean ± SEM.

